The Importance of Air Flow Patterns in Cleanroom Design

Kjeld Lund May 9, 2025
Pharmaceutical Manufacturing in Cleanroom

Introduction


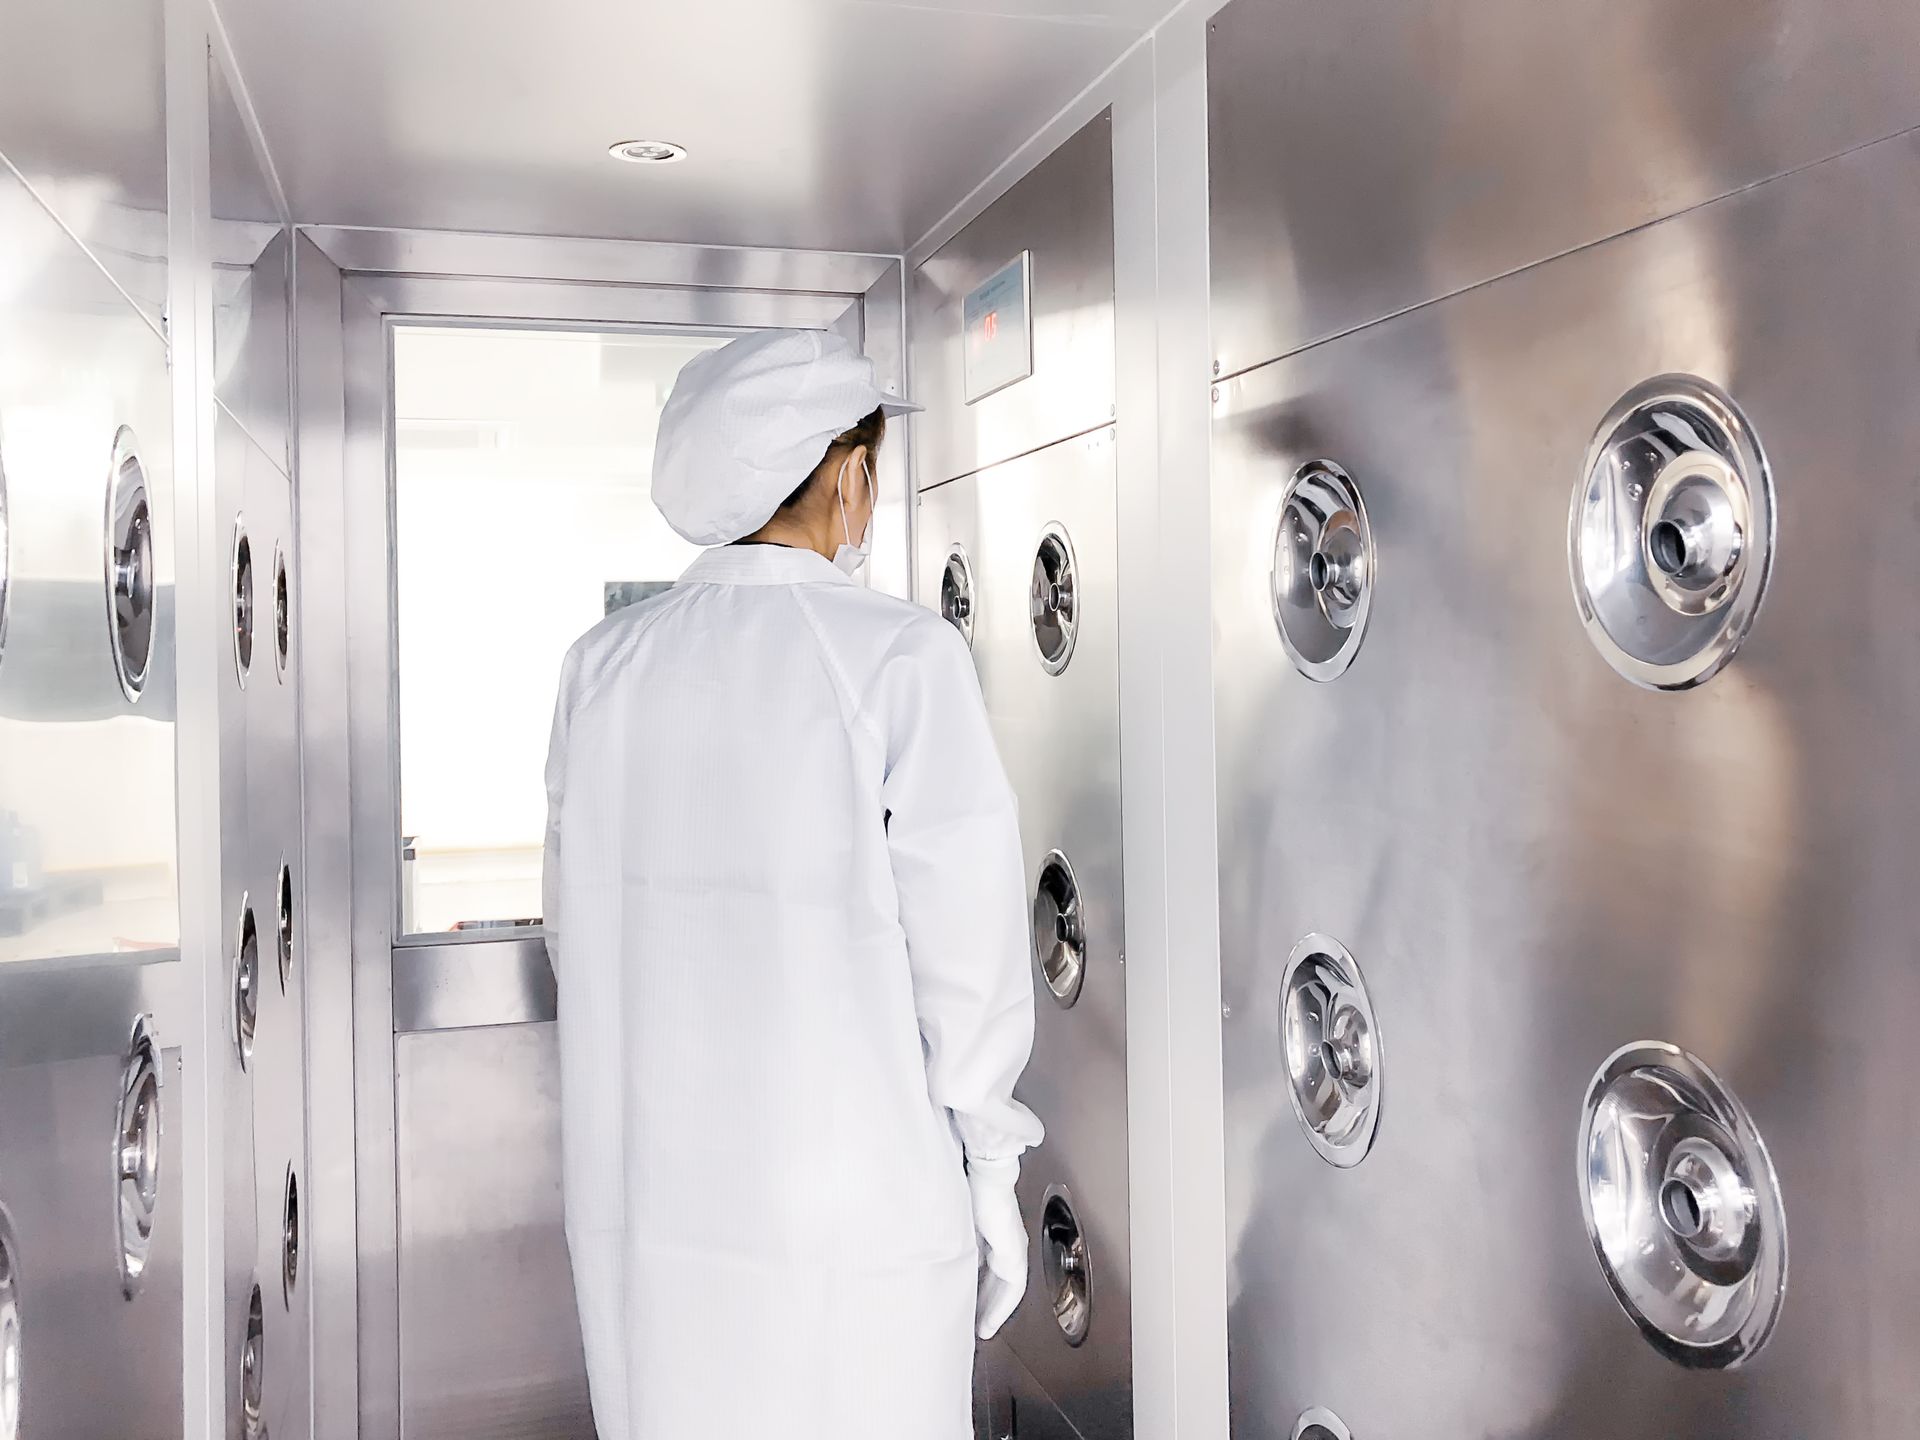
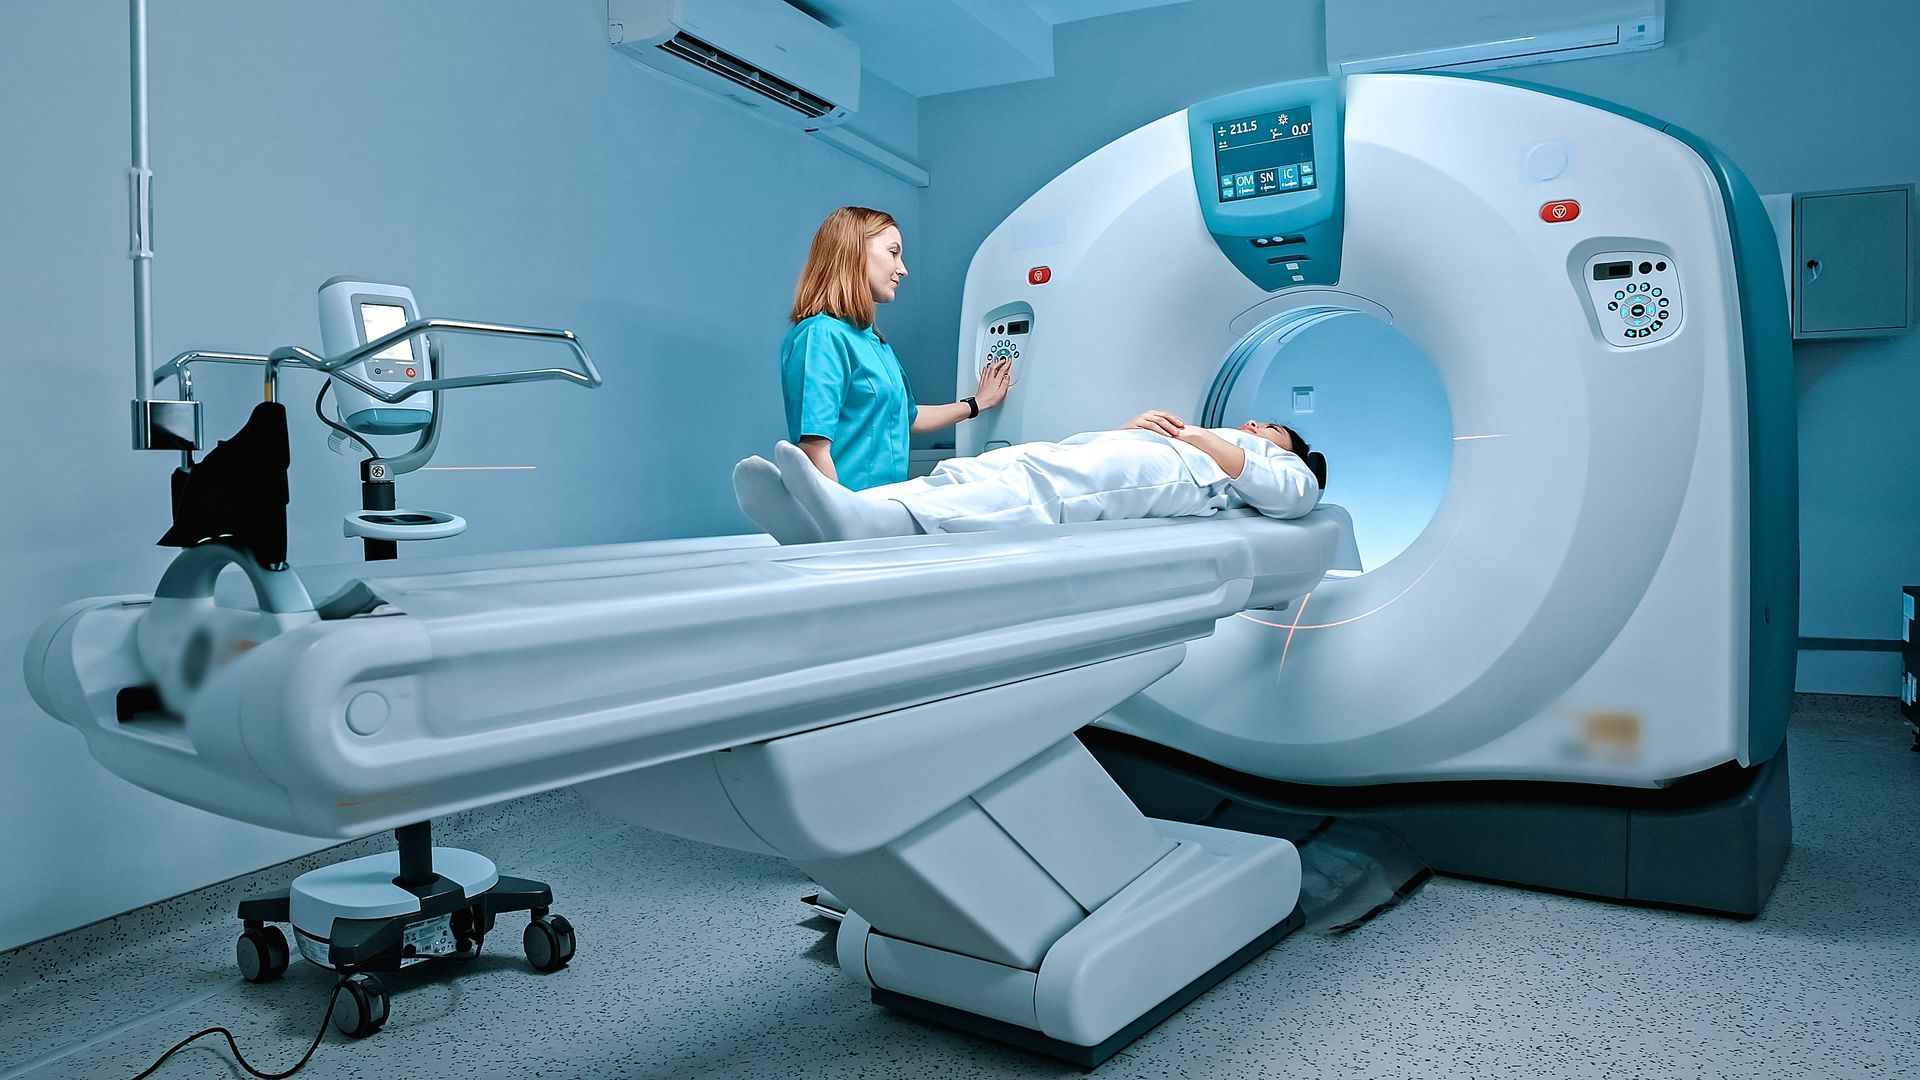
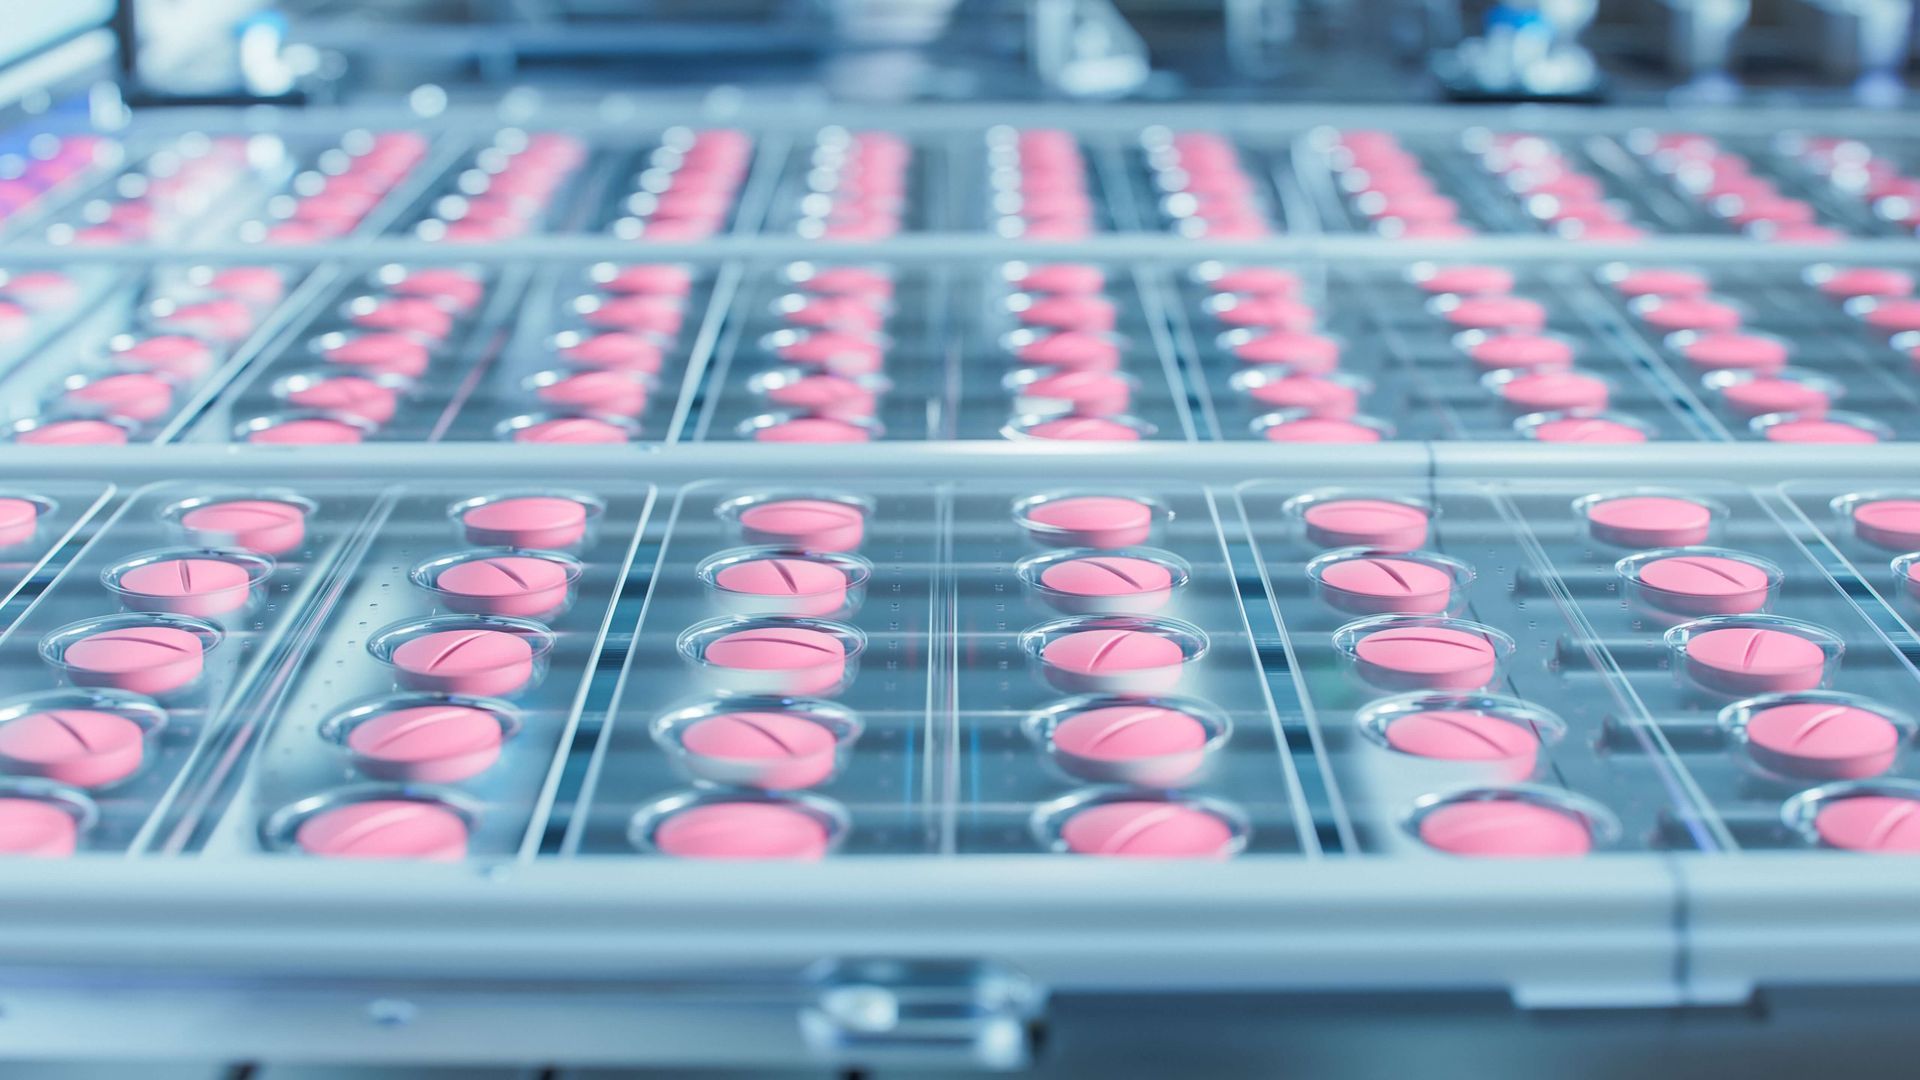
Cleanrooms are controlled environments designed to minimize contamination risks and maintain the highest standards of cleanliness. Industries such as pharmaceuticals, biotechnology, aerospace, semiconductor manufacturing, and medical devices rely on these spaces to ensure the safety, efficiency, and quality of their processes and products. One of the most critical aspects of cleanroom design is the management of airflow patterns.


Proper airflow patterns ensure that particulate contamination is minimized, clean air is evenly distributed, and the cleanroom environment remains effective in preventing contamination.


In this article, we will explore why air flow patterns are so important in cleanroom design, how they influence contamination control, and the strategies used to optimize air flow in cleanrooms to meet stringent industry standards.


Understanding Cleanroom Air Flow


Air flow patterns in a cleanroom refer to how air circulates throughout the space, from its entry into the room to its exit. The flow of air directly impacts how contaminants—such as particles, dust, or microorganisms—are carried and removed from the environment. Airflow also affects the room's pressure, temperature, humidity, and, ultimately, its classification according to standards like ISO 14644-1.


The main goal of airflow design in a cleanroom is to ensure that particles generated within the cleanroom, whether from equipment, materials, or personnel, are swiftly removed without contaminating the workspace or settling onto sensitive products. Proper air flow patterns achieve this by directing contaminated air out of the cleanroom, replacing it with clean, filtered air.


The Role of Airflow in Cleanroom Contamination Control


Contamination control is one of the core functions of cleanroom airflow design. In cleanrooms, contamination can originate from several sources:


  • Personnel: Workers in cleanrooms, even with protective gowns and gear, can shed skin cells, hair, and particles. Proper airflow ensures that these particles are removed from the workspace before they have a chance to settle on surfaces or products.
  • Equipment and Materials: Cleanroom equipment, machinery, and materials may also generate particulate contamination. Efficient airflow ensures that particles generated by these sources are quickly carried away from sensitive areas.
  • External Contamination: Airflow patterns can also help control the ingress of contaminants from external sources, such as ventilation systems or the air outside the cleanroom. Ensuring a proper differential pressure between the cleanroom and adjacent areas reduces the risk of contaminants entering the cleanroom from uncontrolled spaces.


By designing air flow to remove particles from critical areas efficiently, cleanroom designers help ensure the integrity and sterility of the products being manufactured or processed.


Types of Airflow Patterns in Cleanroom Design


There are several types of airflow patterns commonly used in cleanroom design, each of which plays a different role in particle control and cleanroom performance:


1. Laminar Flow


Laminar flow is one of the most commonly used airflow patterns in cleanrooms, particularly in environments where the risk of contamination is high, such as pharmaceutical manufacturing or semiconductor fabrication.


In laminar flow, air moves in parallel layers with minimal disruption between them. This flow pattern is characterized by smooth, unidirectional movement, which helps sweep contaminants away from sensitive areas. Laminar flow can be horizontal or vertical, depending on the cleanroom's design.


  • Vertical Laminar Flow: In vertical laminar flow, air is drawn from the ceiling and moves downward toward the floor. This type of flow is most common in cleanrooms where sensitive products or processes are located near the floor, such as in assembly areas or packaging areas. The air is typically filtered through HEPA (High-Efficiency Particulate Air) or ULPA (Ultra-Low Penetration Air) filters before being introduced into the cleanroom to ensure the highest possible level of air purity.
  • Horizontal Laminar Flow: In horizontal laminar flow, air is drawn into the cleanroom from one side and moves horizontally across the room, typically towards an exhaust vent or filtration system. This design is often used in areas where large equipment or workbenches are placed along one side of the room.


Advantages of Laminar Flow:

  • Effective in sweeping airborne particles away from critical areas.
  • Minimizes turbulence that could disturb the particulate settling in sensitive areas.
  • Provides consistent air distribution across the cleanroom, ensuring all areas receive a uniform level of air cleanliness.

Considerations:

  • It requires precise control over airflow to ensure that particles are continually removed.
  • Potential inefficiency in rooms with a large number of obstructions or complex layouts, as airflow might not reach all areas efficiently.


2. Turbulent Flow


Turbulent flow, on the other hand, is less controlled than laminar flow and results in chaotic air movement. This flow pattern is typically found in environments where contamination is less critical, such as in low-ISO cleanrooms (ISO 7 and 8), or in support areas like storage rooms.


While turbulent flow is less efficient at removing particles from critical areas, it can still play an important role in larger, more open spaces or less-sensitive parts of the cleanroom. The air will still eventually be filtered, but the air moves more erratically compared to laminar flow.


Advantages of Turbulent Flow:

  • Easier to implement in larger or less critical areas of a cleanroom.
  • Can be used in non-production areas where contamination control requirements are less stringent.

Considerations:

  • Less effective at maintaining uniform cleanliness in areas where contamination is critical.
  • Can lead to stagnant air pockets, where particles can accumulate.


3. Unidirectional Flow


Unidirectional flow, often used in combination with laminar flow, refers to a specific type of air circulation where the airflow is directed in one consistent direction. Unidirectional airflow is designed to ensure that contaminants are constantly being directed out of the cleanroom, and it is typically used in spaces like clean benches, isolators, or controlled workstations.


This airflow system combines laminar flow principles with the continuous movement of air to create a highly controlled, sterile environment in areas where very high standards are required.


Advantages of Unidirectional Flow:

  • Perfect for maintaining a highly sterile environment for critical processes such as drug compounding or electronics manufacturing.
  • Reduces the potential for cross-contamination between workers or workstations.

Considerations:

  • Requires careful design and placement of air supply and exhaust systems.
  • Generally not suitable for large-scale production areas due to its focused nature.


The Importance of Airflow Patterns for ISO Cleanroom Classes


Cleanroom standards, such as those set by the International Organization for Standardization (ISO 14644-1), define the cleanliness of a room based on the number of particles per cubic meter at specific sizes. As the cleanroom class decreases (i.e., from ISO 5 to ISO 8), the acceptable particle count increases, which directly impacts airflow requirements.


  • ISO Class 1 to Class 5: These classes require highly efficient airflow systems, including laminar flow and unidirectional airflow. The air must be filtered multiple times (often through HEPA or ULPA filters) to remove particles, and the air must be delivered in a controlled, uniform manner to avoid turbulence and particle deposition. Cleanrooms of these classes are typically used for highly sensitive processes like semiconductor manufacturing, pharmaceuticals, and biotechnology.
  • ISO Class 6 to Class 8: As the cleanliness standards become less strict, airflow systems can become less stringent, but they still need to ensure that contaminants are removed from critical areas. These classes are often found in industries like food packaging or less-sensitive assembly lines, where a less precise level of airflow is acceptable.


Key Considerations for Designing Airflow Patterns


When designing airflow patterns in a cleanroom, several factors need to be taken into account:


  1. Cleanroom Size and Layout: The size and layout of the cleanroom will influence how air flows through the space. For large rooms, multiple air handling units may be needed, and careful planning is required to ensure that airflow is evenly distributed across all critical areas.
  2. Personnel and Equipment Placement: The location of personnel and equipment will also influence air flow patterns. Workstations, machinery, and equipment should be positioned in such a way that they do not disrupt airflow or create turbulence that could lead to contamination.
  3. Airflow Velocity: The velocity of the airflow must be carefully regulated to avoid disturbing settled particles or causing turbulence that could affect contamination control. Too high a velocity can cause particulate movement, while too low a velocity may allow particles to settle back onto surfaces.
  4. Pressure Differentials: To ensure that contaminants do not enter the cleanroom, pressure differentials between the cleanroom and surrounding areas must be maintained. Positive pressure is typically used in cleanrooms to prevent the ingress of contaminated air from adjacent spaces.
  5. Filtration Systems: Filtration is a critical component of cleanroom airflow. Air entering and exiting the cleanroom must pass through high-efficiency filters, such as HEPA or ULPA, to ensure that airborne particles are removed before the air enters the cleanroom or exits to the environment.


Conclusion


Airflow patterns are a fundamental aspect of cleanroom design and performance. By ensuring that air circulates effectively, cleanrooms can maintain their cleanliness standards, protect product integrity, and prevent contamination from personnel, equipment, and external sources.


Whether utilizing laminar flow, turbulent flow, or unidirectional flow, the proper design of airflow systems is essential for meeting ISO classification requirements and creating a safe, sterile environment for sensitive processes and products. Cleanroom designers must carefully consider factors such as room layout, airflow velocity, personnel positioning, and filtration systems to achieve the best possible airflow design for their specific application.


Read more: All About Cleanrooms - The ultimate Guide


Blue and white capsules on a pharmaceutical production line.
By Kjeld Lund Mai 1, 2026 May 1, 2026
Cleanroom Sensor Networks: Integrating IoT for Continuous Oversight 1. Introduction Cleanroom environments depend on timely, accurate, and continuous monitoring of critical parameters—including pressure, temperature, humidity, particle counts, and, increasingly, equipment and process states. Emerging IoT (Internet of Things) sensor networks provide powerful tools for enhancing visibility, improving contamination control, and strengthening compliance with ISO 14644 , EU GMP Annex 1 , and 21 CFR Part 11 expectations for data integrity. This article provides a technical and practical framework for designing, validating, and operating IoT-enabled cleanroom sensor networks to achieve continuous oversight across the cleanroom lifecycle. 2. The Function of IoT in Cleanroom Monitoring IoT expands traditional fixed-point monitoring into a more dynamic, interconnected system capable of: Continuous, high-resolution environmental monitoring (pressure, temperature, humidity, airborne particles, gas levels). Contextual data capture around equipment states, alarms, door openings, and human movement. Real-time analytics for early detection of deviations. Cloud or edge-based data processing to support predictive maintenance and trend-based decision making. IoT sensor networks do not replace regulated EMS/BMS systems; they augment them by adding granularity, redundancy, and advanced analytics capability. 3. Defining Use Cases Within the Contamination Control Strategy (CCS) IoT deployment must be driven by clear objectives. Common CCS-aligned use cases include: Microenvironment tracking near critical zones to confirm stability between formal EMS sample points. Predictive maintenance for HVAC, HEPA filters, and fans via vibration, differential pressure, or motor current data. Door and movement analytics to understand the effect of personnel flow on contamination. Dynamic risk alerts when local environmental conditions deviate from expected baselines. Enhanced investigation capability for EM excursions and airflow-related anomalies. Each use case must be documented and justified within the CCS and supporting risk assessments. 4. Sensor Selection and Technical Requirements Selecting sensors for an IoT network requires careful evaluation of accuracy, stability, calibration, and cleanroom compatibility. Key parameters to consider: Accuracy and resolution , particularly for pressure sensors (±0.1–0.5 Pa for critical zones). Response time , especially for transient events such as door openings. Environmental robustness , including non-shedding housings and ISO-compatible materials. Calibration traceability , including field calibration or automated self-check features. Connectivity options , such as Wi-Fi 6, LoRaWAN, BLE, or wired PoE, depending on facility infrastructure. Battery life or power-over-Ethernet considerations for continuous-duty applications. Data integrity and cybersecurity , ensuring compliance with GMP expectations. Sensors deployed in Grade A/B areas must be assessed for vibration, airflow interference, and compatibility with airflow patterns. 5. Network Topology and System Architecture The architecture must balance reliability, latency, and data throughput. Common cleanroom IoT architectures: Star topology via centralized gateway : Simple, scalable, ideal for low-latency applications. Mesh networks : Provide redundancy and better coverage in complex layouts but require robust cybersecurity and careful RF planning. Hybrid architectures integrated with EMS/BMS: IoT nodes feed a central historian while regulated sensor channels remain validated in EMS/BMS. Architectural considerations include: Redundant gateway paths to prevent monitoring gaps. Edge computing capabilities for local preprocessing and anomaly detection. Firewall and network segmentation to separate operational technology (OT) from IT systems. Scalability for future expansions. 6. Interference, Layout, and Installation Constraints Installing IoT sensors in cleanrooms must not compromise cleanliness, airflow, or ergonomics. Key constraints: Airflow disruption : Sensor housings must be low-profile to avoid interfering with unidirectional airflow, particularly in Grade A zones. Electromagnetic compatibility (EMC) : Devices must not interfere with critical equipment, and vice versa. Placement strategy : Based on: Airflow pattern studies Pressure cascade design Known contamination hotspots Operator workflow paths Material selection : Surfaces must be smooth, non-shedding, compatible with disinfectants, and able to withstand cleaning frequencies. Installation should be validated via airflow visualization and local particle studies if sensors are placed near critical operations. 7. Data Integration, Management, and Integrity Data integrity is paramount. IoT networks must meet GxP data-handling requirements. Essential features: Timestamp synchronization across all nodes using NTP or GPS-locked clocks. Secure communication protocols (TLS, VPN tunnels) to protect transmitted data. Audit trails that capture configuration changes, calibration actions, and user interactions. Redundant storage with buffered local memory in case of network interruptions. Validation of software and firmware , including change control for updates. Compliance with ALCOA+ principles for attributed, legible, contemporaneous, original, accurate data. Integration with existing EMS/BMS should include data mapping, transfer validation, and interface qualification. 8. Advanced Analytics and Predictive Capabilities The power of IoT lies in real-time analytics and predictive modeling. Applications include: Anomaly detection using machine learning models to identify subtle pressure or humidity drifts not detectable via fixed-point monitoring. Predictive filter loading using continuous differential pressure data across HEPA/ULPA filters. Correlation analysis between people movement, HVAC cycling, and particle levels. Energy optimization by identifying periods of overventilation or inefficient equipment use. Root-cause investigations supported by multivariate trend overlays (pressure + temperature + door log + vibration + particle data). Analytics outputs must be validated and documented for GMP decision making. 9. Validation Approach for IoT Sensor Networks IoT systems used in GMP environments require structured qualification. DQ – Design Qualification Define intended use, sensor specifications, network architecture, cybersecurity measures. Verify compatibility with CCS and EM strategy. IQ – Installation Qualification Confirm correct installation of sensors, gateways, power sources, mounting hardware. Verify materials, calibration certification, and correct labeling. OQ – Operational Qualification Confirm sensor accuracy across operating ranges. Verify communication stability, data transfer rates, alarm logic, and failover performance. Conduct latency and data-loss stress testing. PQ – Performance Qualification Validate performance under real operating conditions. Demonstrate reliability through long-duration pilot monitoring. Correlate IoT data with EMS/BMS baselines and environmental events. Acceptance criteria must be tied to measurement tolerances, alarm requirements, and regulatory expectations. 10. Alarm Strategy, Event Handling, and Decision Rules A well-defined alarm strategy prevents alarm fatigue and ensures actionable insights. Design considerations: Tiered alerts (informational → warning → action). Contextual rules , e.g., suppressing door-related pressure alarms if door-open state is confirmed. Predictive alarms for trends indicating impending drift rather than waiting for limit breaches. Defined operator responses , integrated into SOPs and training programs. Automated notification to relevant teams via SMS, e-mail, or BMS integration. The alarm philosophy must align with both quality requirements and operational realities. 11. Lifecycle Management and Continuous Improvement IoT systems must be actively managed through their lifecycle. Key practices: Scheduled calibration and verification following sensor-specific intervals. Firmware and software change control , including cybersecurity patching. Periodic performance review , including drift analysis and error-rate evaluation. CCS integration , updating risk assessments based on IoT data trends. System scalability planning , including capacity for new sensors or analytics modules. Lifecycle reviews should align with annual CCS and EM program evaluations. 12. Common Pitfalls and How to Avoid Them Frequent challenges include: Deploying sensors without a clear CCS-linked purpose. Underestimating network robustness requirements (coverage, latency, redundancy). Poorly defined alarm rules leading to operator desensitization. Inadequate calibration or drift compensation, resulting in unreliable data. Failure to integrate IoT data with existing EMS/BMS systems, creating data silos. Insufficient cybersecurity controls for wireless sensor networks. Avoiding these pitfalls requires disciplined engineering, robust validation, and cross-functional planning. 13. Conclusion IoT-enabled cleanroom sensor networks offer transformative potential for continuous oversight, enhanced contamination control, and more predictive HVAC and process management. When implemented with rigorous engineering, clear CCS alignment, validated data integrity controls, and lifecycle governance, IoT systems can significantly strengthen both operational performance and regulatory compliance. These technologies elevate cleanroom monitoring from periodic snapshots to continuous, contextualized environmental intelligence , supporting a more proactive and resilient contamination control strategy. Read more here: About Cleanrooms: The ultimate Guide
Two people in protective suits in a white room. One holds a black air filtration bag. Another records on a clipboard.
By Kjeld Lund April 24, 2026 April 24, 2026
Air Exchange Rates: Technical Implications for Energy, Stability, and Compliance 1. Introduction Air exchange rate (AER)—often expressed as air changes per hour (ACH) —is one of the most influential design and operational parameters in cleanrooms. It affects particle control , thermal stability , pressurization , and energy consumption , making it a central factor in meeting ISO 14644 , GMP Annex 1 , and process-specific requirements. This article provides a technically rigorous overview of how AER decisions influence cleanroom performance, energy use, and compliance—with emphasis on engineering trade-offs and lifecycle management strategies. 2. Understanding Air Exchange Rates in Cleanroom Context Air exchange rate is the ratio between total supply airflow and room volume, indicating how quickly the room air is replaced. While ISO 14644 does not prescribe fixed ACH values , it requires that the installed airflow is sufficient to maintain the required cleanliness class , considering particle loads, process heat, personnel activity, and layout. Typical AER ranges used in practice: ISO 8: ~10–25 ACH ISO 7: ~20–40 ACH ISO 6: ~60–90 ACH ISO 5 (turbulent-mixed areas): ≥100 ACH (depending on process) ISO 5 unidirectional zones: Defined by face velocity , not ACH; however, total flow may equate to >200–400 ACH depending on geometry. These values vary based on contamination loads, heat sources, operational behavior, and risk assessments. 3. Air Exchange Rate and Particle Removal Efficiency AER directly influences how quickly contaminants—both viable and non-viable—are diluted and removed from the environment. Higher ACH → faster dilution and better recovery performance. This is particularly relevant for: ISO classification testing at rest (ISO 14644-1). Recovery tests per ISO 14644-3, where systems must restore classification following particulate disturbances within a defined time. GMP Grade B/C rooms supporting aseptic operations. However, after a certain point, increasing ACH offers diminishing returns because the contribution of turbulence, deposition, and source strength outweighs dilution effects. Engineering judgment is required to avoid energy waste while still meeting regulatory expectations. 4. Interactions with Pressure Control and Cascades Stable room pressurization depends on a precise balance of supply, return, and exhaust airflow. AER changes affect: Pressure differentials between zones (e.g., 10–15 Pa typical in GMP cascades). Leakage compensation , especially in rooms with poor envelope tightness. Door operation behavior , influencing transient pressure stability. If supply and return flows are adjusted to change ACH without recalibrating pressure controls, the facility may experience: Pressure drift Cross-contamination risks Alarm frequency increases HVAC oscillations or control instability ACH modifications should therefore trigger full airflow rebalancing and pressure verification . 5. Thermal Stability and Humidity Control Implications Air exchange provides not only contamination control but also thermal and humidity regulation. Higher ACH improves heat removal, which is beneficial in: Equipment-dense ISO 7/8 rooms Filling suites with conveyor motors, lighting loads Buffer prep or compounding areas with exothermic processes However, high airflow volumes can also create: Overcooling , especially in low-load periods Poor humidity control , when supply air conditions exceed coils’ ability to maintain dewpoint targets Increased sensitivity to seasonal changes in supply air density Optimizing ACH must therefore consider HVAC coil capacity, reheat availability, control responsiveness, and thermal zoning. 6. Energy Consumption and Sustainability Considerations Cleanroom HVAC systems are energy-intensive, and ACH is a major driver. Every increase in ACH increases: Fan energy consumption , scaling approximately with the cube of airflow for many systems Filter loading , since HEPA/ULPA filters generate significant pressure drop Cooling and heating demand , as more supply air requires more conditioning Typical contributors to energy load in cleanrooms: 50–70%: Fan power (depending on filtration and system design) 20–40%: Cooling/dehumidification 5–15%: Reheat / humidity stabilization Reducing ACH—when justified by risk—can yield significant operational savings. ISO 14644-16 provides guidance on energy efficiency measures, including ACH optimization, while ensuring performance compliance. 7. Designing the “Right” ACH: Risk-Based Approach Determining appropriate AER must follow a structured engineering and contamination-control methodology. Key factors include: Contamination sources: Personnel density, material movement, process emissions. Airflow regime: UDAF vs. turbulent-mixed flow. Process sensitivity: Aseptic filling vs. packaging vs. weighing. Environmental stability requirements: Temperature/humidity tolerances. Recovery time expectations: Faster recovery requires higher ACH or improved flow uniformity. Historical EM data: Trend analysis and worst-case scenarios inform ACH justification. Risk-based rationale must be documented in the Contamination Control Strategy (CCS) and Basis of Design (BOD) . 8. ACH in Unidirectional vs. Turbulent-Mixed Airflow Systems ACH has different meanings depending on airflow type. Unidirectional Flow (UDAF) Governed by face velocity (0.36–0.54 m/s for most Grade A zones). Total ACH is less relevant, but total flow contributes to: Air curtain stability Wash-over effectiveness Particle transport characteristics Turbulent-Mixed Flow ACH directly controls dilution and mixing efficiency. Uniform distribution of supply air (FFUs, terminal HEPA diffusers) is critical. Too high an ACH can create unwanted turbulence , reducing cleanliness performance. Optimizing both types of systems often involves hybrid modelling using CFD analysis , complemented by field measurements. 9. ACH and Cleanroom Envelope Performance Airtightness strongly influences how much airflow is required to maintain pressurization and cleanliness. Poor envelope integrity results in: Higher airflow needed to maintain differential pressures Energy inefficiency Greater risk of airborne infiltration from adjacent spaces Increased HVAC instability during door operations Envelope testing (e.g., pressure decay, leak detection) should be performed at commissioning and periodically during lifecycle management. 10. Monitoring, Controls, and Dynamic Adjustment Advanced Building Management Systems (BMS) and Environmental Monitoring Systems (EMS) can support smarter ACH control. Potential strategies include: Dynamic ACH modulation based on operational state (e.g., set-up, production, cleaning, idle). Variable air volume (VAV) supply and return systems with pressure-cascade controls. Demand-based control triggered by environmental parameters (e.g., temperature, differential pressure). However, dynamic control must be carefully validated to avoid compromising compliance or airflow stability. 11. Qualification and Compliance Implications Air exchange rate impacts multiple qualification activities. During OQ (Operational Qualification) Verify supply, return, and exhaust airflows. Confirm room pressurization and stability. Conduct recovery tests at defined ACH. During PQ (Performance Qualification) Demonstrate environmental stability at operational loads. Correlate ACH settings with environmental monitoring results. Validate that changes in operations do not degrade air quality. Any ACH modification requires requalification , especially in Grade A/B zones. 12. Lifecycle Management and Periodic Review ACH settings should not remain static for the life of the cleanroom. Lifecycle evaluation must consider: EM trending (viable and non-viable) Shifts in process or personnel load Equipment changes affecting heat or airflow Filter loading and fan capacity changes Seasonal HVAC performance variations Energy optimization initiatives These reviews should be formally documented in the CCS, HVAC strategy, and environmental monitoring evaluation reports. 13. Common Pitfalls and How to Avoid Them Frequent issues observed in facilities include: Using overly high ACH without documented justification Failing to rebalance pressure cascades after ACH adjustments Assuming more airflow = better cleanliness , which is not always true Ignoring turbulence effects at high flows that disrupt critical zones Insufficient documentation linking ACH to design and risk assessment Energy penalties without measurable contamination-control benefit Avoiding these pitfalls requires a disciplined, engineering-led approach. 14. Conclusion Air exchange rates exert profound influence on cleanroom performance, energy consumption, and regulatory compliance. AER must be justified, validated, and continuously aligned with contamination control goals, HVAC design, operational needs, and sustainability objectives. By applying risk-based engineering principles, integrating ACH decisions into the CCS, and maintaining rigorous lifecycle control, organizations can ensure stable cleanroom conditions, optimize energy use, and demonstrate full compliance with ISO 14644 and GMP Annex 1 expectations. Read more here: About Cleanrooms: The ultimate Guide
Person in cleanroom suit examines a silicon wafer under a microscope in a laboratory.
By Kjeld Lund April 17, 2026 April 17, 2026
Implementing Real-Time Viable Particle Monitoring Technologies 1. Introduction Real-time viable particle monitoring technologies are moving from “interesting innovation” to serious design option in modern aseptic facilities. EU GMP Annex 1’s increased focus on continuous monitoring, rapid detection, and robust trending has triggered renewed interest in systems capable of providing near real-time indication of microbiological contamination , rather than waiting days for incubation results. This article outlines practical, engineering-focused approaches to implementing real-time viable monitoring in ISO-classified areas, with emphasis on technology limitations, integration into existing environmental monitoring (EM) programs, and alignment with contamination control strategies (CCS). 2. Understanding Real-Time Viable Monitoring Technologies Unlike conventional EM (active air sampling, settle plates, contact plates), real-time viable systems attempt to distinguish biological from non-biological particles as they pass through an instrument. Common technology principles include: Biofluorescent particle counters (BFPC): Particles are illuminated by one or more lasers. Optical scattering gives size information; autofluorescence (from NADH, riboflavin, etc.) is used as a surrogate for “viable/biological.” Flow-cytometry-based systems: Particles are stained with fluorescent dyes and passed single-file through a detection zone. More complex, generally used in off-line or at-line applications. Integrated hybrid systems: Combine non-viable counting with biofluorescence to provide simultaneous total and “viable-like” counts in the same sample stream. Important: these systems do not provide organism identification and do not fully replace traditional culture-based methods. They provide fast indication of changes in biological load , useful for process control and early warning. 3. Regulatory and CCS Context EU GMP Annex 1 and ISO 14644-2 do not mandate specific technologies, but they do expect that monitoring strategies are: Risk-based and science-driven . Capable of detecting unusual events and supporting rapid response. Integrated into a Contamination Control Strategy (CCS) . Real-time viable systems can support these expectations by: Providing continuous or high-frequency data in Grade A and critical Grade B zones. Improving visibility during high-risk operations, set-ups, and interventions. Enhancing investigations of EM excursions or media fill failures. However, regulators expect that any such technology is formally validated , its limitations understood , and its role clearly defined alongside traditional EM —not as a black-box replacement. 4. Defining Objectives: Why Do You Want Real-Time Viable Data? Before selecting equipment, define clear objectives. Common drivers include: Early warning capability in Grade A/RABS/isolators during filling or aseptic manipulations. Enhanced understanding of how interventions and equipment states influence viable load. Continuous monitoring of normally difficult-to-sample locations (inside isolators, at critical transfer points). Support for process optimization , e.g., comparing different line speeds, set-up sequences, or intervention techniques. Each objective should map to: Specific locations (e.g., filling needle zone, stopper bowl, transfer ports). Specific process steps or risk scenarios. Defined decisions (what actions will you take when the system alarms?). Without clear objectives and decision rules, the system will generate large amounts of data but little actionable value. 5. Designing the System and Selecting Locations Location strategy should combine: Risk assessments (CCS, FMEA, HACCP-style reviews). Airflow visualization studies (smoke studies) to identify where particles reaching the product are most likely to originate. Existing EM data , especially past excursions or persistent “weak spots.” Practical design rules: Prioritize Grade A critical zones : directly above open containers, filling needles, open transfer points, stopper bowls. For isolators, consider in-chamber sampling in the main aseptic workspace, not just background. For RABS, pay attention to interaction zones (glove ports, open-front zones, component loading points). Avoid sampling points too close to HEPA outlets or returns where flow may not be representative of what the product “sees.” Sampling flow rates, tubing length, and bends must be designed according to manufacturer recommendations to avoid particle losses and false trends. 6. Integration with Existing EM Programs Real-time viable monitoring should be embedded , not bolted-on, to the facility’s EM concept. Key integration points: Complement, don’t replace, plates: Traditional active air and surface sampling remain necessary for identification and trend continuity . Real-time systems are typically defined as additional, rapid-indication tools . Harmonize locations: Wherever practical, align real-time sampling heads with existing EM locations so that data can be correlated. Sampling strategy: Real-time devices run continuously (or at high duty cycles) in defined windows (e.g., entire fill). Culture-based samples are taken at defined points (start, middle, end, interventions), providing confirmatory and ID data. The updated EM plan should show how data streams interact , what each is used for, and how they jointly satisfy Annex 1 expectations. 7. Qualification and Validation Strategy Implementing real-time viable monitoring requires a structured qualification approach similar to other GMP-critical systems. Typical qualification elements: DQ (Design Qualification): Justification of chosen technology. Definition of locations, interfaces, sampling rates, and data handling. IQ (Installation Qualification): Verification of correct installation, materials of construction, tubing routing, and environmental compatibility. Calibration status and certificates for flow, laser power, and sensors. OQ (Operational Qualification): Functionality tests across operating ranges (flow, counting range, alarm logic). Verification of signal stability, repeatability, and response to standard test aerosols. Method validation / performance characterization: Correlation studies vs. conventional active air sampling under controlled challenge conditions. Evaluation of false positive/negative rates (e.g., non-biological fluorescence, under-detection of low emitters). Determination of system detection limit and dynamic range. Documentation should clearly describe how “viable-like” counts are defined , including any thresholds, signal processing, and classification logic used by the system. 8. Establishing Alarm Limits and Response Criteria Unlike traditional EM, real-time systems can generate hundreds or thousands of data points per batch. Alarm strategy must be carefully designed. Key steps: Baseline studies: Operate the system over multiple representative batches under “good” conditions to build a baseline distribution. Segment data by operation phase (set-up, steady filling, interventions, shutdown). Define alert and action levels: Use statistical evaluation (e.g., percentiles) as a starting point. Adjust based on risk of the operation and tolerance for false alarms. Time-based rules: Consider alarms based on sustained elevations over defined intervals, not single spikes, to avoid overreaction to transient non-critical events. Link to procedures: Define specific actions (e.g., check gown, verify HEPA face velocity, pause line, increase observation, initiate investigation). Ensure that alarm responses are practical , otherwise operators will rapidly lose trust in the system. As experience grows, alarm limits can be refined using accumulated trending data. 9. Data Management, Trending, and Integration with CCS Real-time viable systems generate large data volumes that must be handled in a compliant, meaningful way. Considerations: Data integrity: Audit trails, time synchronization, user access control, secure storage, and backup. Alignment with data integrity principles (ALCOA+). Visualization and reporting: Dashboards that overlay viable-like counts with line states (stops, interventions), HVAC status, pressure, and non-viable particle counts. Trend analysis: Identification of recurring patterns (e.g., specific interventions always causing spikes). Use of trend data in CCS reviews and continuous improvement activities. Deviation support: Ability to retrieve and review time-synchronized real-time data to support investigations of EM excursions, media fill failures, or sterility test failures. The CCS should explicitly describe how real-time data are used in risk management and continuous improvement , not just that they exist. 10. Practical Challenges and Limitations Real-time viable monitoring offers significant potential, but also carries limitations that must be acknowledged. Common challenges: Specificity: Biofluorescence is an indirect marker; some non-biological particles fluoresce and some damaged microorganisms may not. Quantitative comparability: Results may not be directly comparable to “cfu/m³”; they are often reported as “biological particle counts” and must be interpreted accordingly. Instrument sensitivity to environment: Vibration, temperature swings, and condensation can affect performance. Maintenance and contamination: Systems can themselves become contaminated; maintenance and cleaning procedures must be defined and validated. Regulatory familiarity: Inspectors may be cautious if the technology appears to “replace plates.” Clear positioning within the EM program is essential. Being transparent about these limitations in validation reports and CCS discussions builds confidence and avoids unrealistic expectations. 11. Lifecycle Management and Periodic Review Once implemented, real-time viable monitoring must be managed over the full lifecycle. Key lifecycle activities: Periodic performance checks: Routine system suitability tests (e.g., defined aerosol challenge) at defined intervals. Calibration and preventive maintenance: As per manufacturer recommendations and internal procedures, with full documentation. Periodic data review: At least annual review of trends, alarm frequency, false positive/negative patterns, and correlation with traditional EM. Change control: Any modification in sampling location, software version, classification algorithms, or integration must undergo formal impact assessment and revalidation where needed. Continuous improvement: Use insights from real-time data to refine interventions, gowning, layout, and airflow conditions. These activities should be integrated into the site’s quality system and linked to the CCS review cycle. 12. Conclusion Real-time viable particle monitoring technologies provide powerful new visibility into microbiological risk in critical cleanroom zones. When implemented with clear objectives, robust validation, well-designed alarm strategies, and tight integration into the EM program and CCS, they can significantly enhance contamination control and support Annex 1 expectations for continuous, risk-based monitoring. However, success depends on engineering discipline and realistic expectations : these systems are best used as enhanced detection and diagnostic tools , not as simple replacements for culture-based monitoring. Facilities that understand and manage both the strengths and limitations of real-time viable monitoring will be well positioned to operate safer, more robust aseptic processes in the years ahead. Read more here: About Cleanrooms: The ultimate Guide
Show More