Your Cleanroom Specialist
Competence from +100 Cleanrooms and since 1992
Cleanroom 14644 ISO 1-9 FS209E EU GMP ABCD USP 797, 800, 825
Cleanroom Design, Construction, Operation
Limit Your Liability
Cleanroom End User
Limit Your Liability - I make sure that Your Cleanroom project meets Your demands, from Design to Operation.
Architects
Limit Your Liability- I make sure that Your Cleanroom Specification will meet the End Customer needs, and at the right budget/cost.
Contractors
Limit Your Liability- I make sure that all building processes are aligned, in line with the Cleanroom demand.
Consulting Engineers
Limit Your Liability- I offer extended Cleanroom competence
Alata
Alice
Open Sans
Noto Sans
Bebas Neue
Great Vibes
Rock Salt
Exo
Belgrano
Overlock
Cinzel
Indie Flower
Staatliches
Roboto Slab
Lato
Noto Serif
Open Sans
Montserrat
Ubuntu
Rubik
Delius
Amiri
Montserrat

Learn about UV-C, H₂O₂, & ozone disinfection methods for cleanrooms. Ensure compliance with ISO 14644. Contact us for expert guidance.
Understand cleanroom pressure control algorithms, from PID tuning to adaptive methods. Limit your liability with expert solutions.
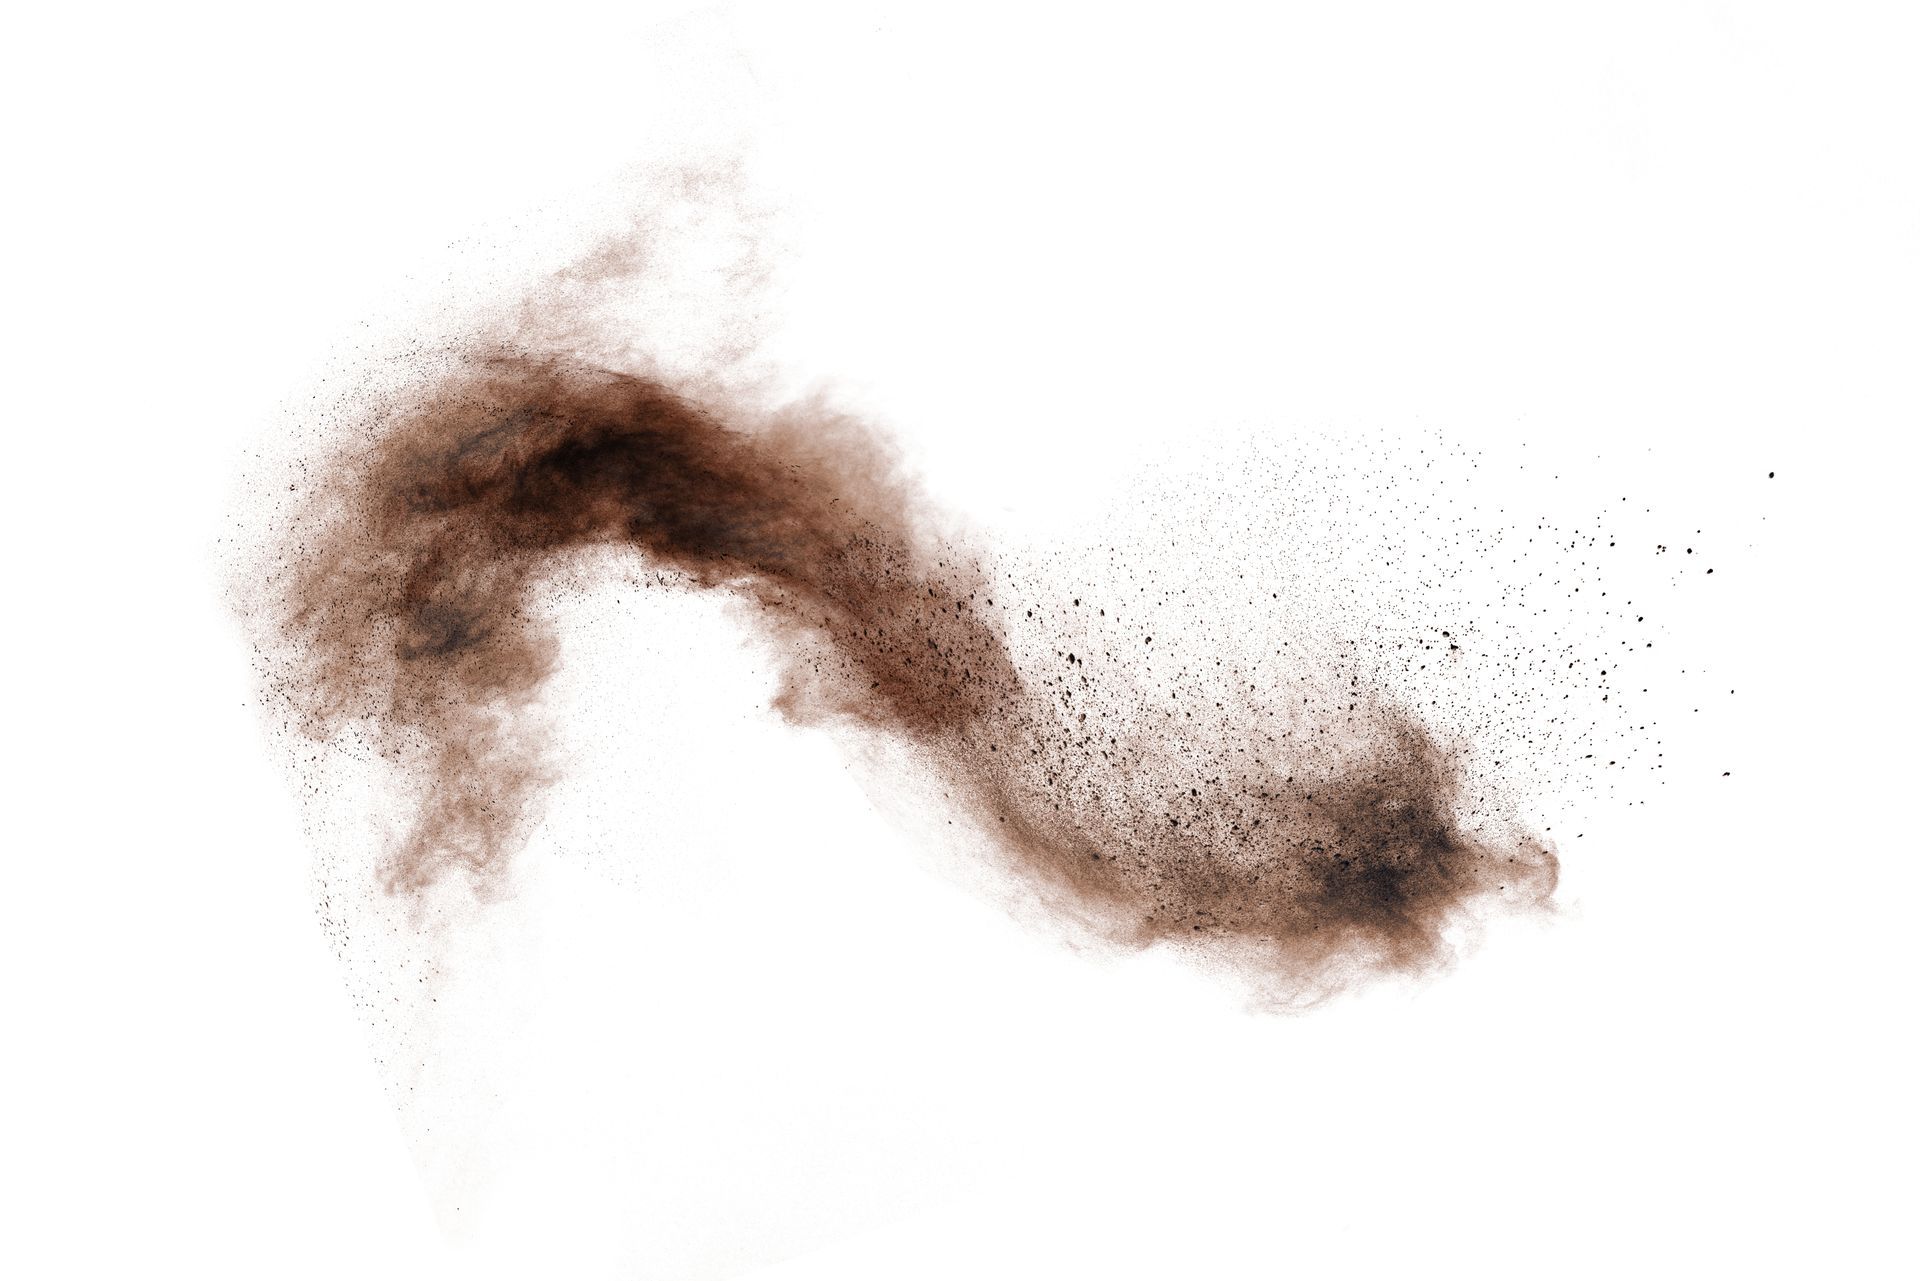
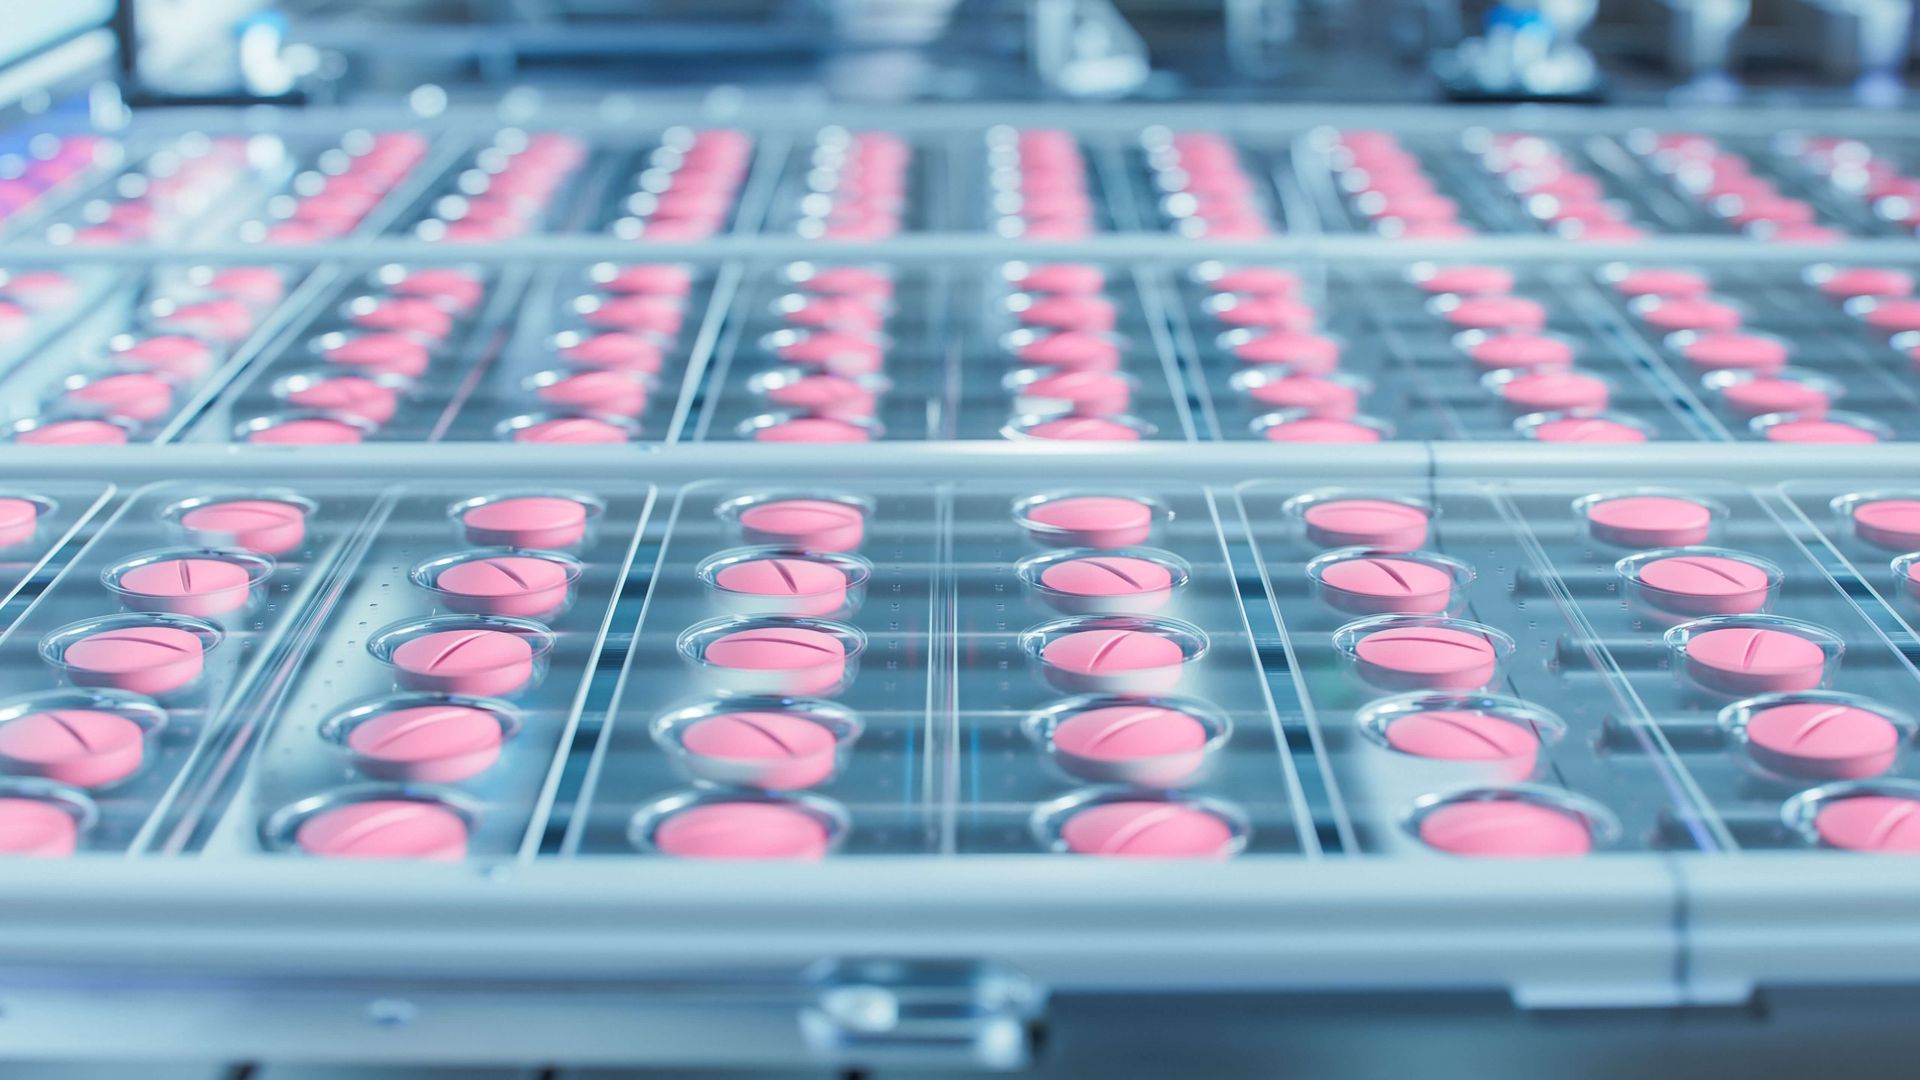
Understand macro-agglomerates & their effects on product quality in pharma. Limit your liability with our expert insights today!
Cleanroom Consulting Services from Design to Operation