Managing Cleanroom Contamination: Best Practices

Kjeld Lund September 25, 2024
14644 Cleanroom ISO7 Room

Introduction


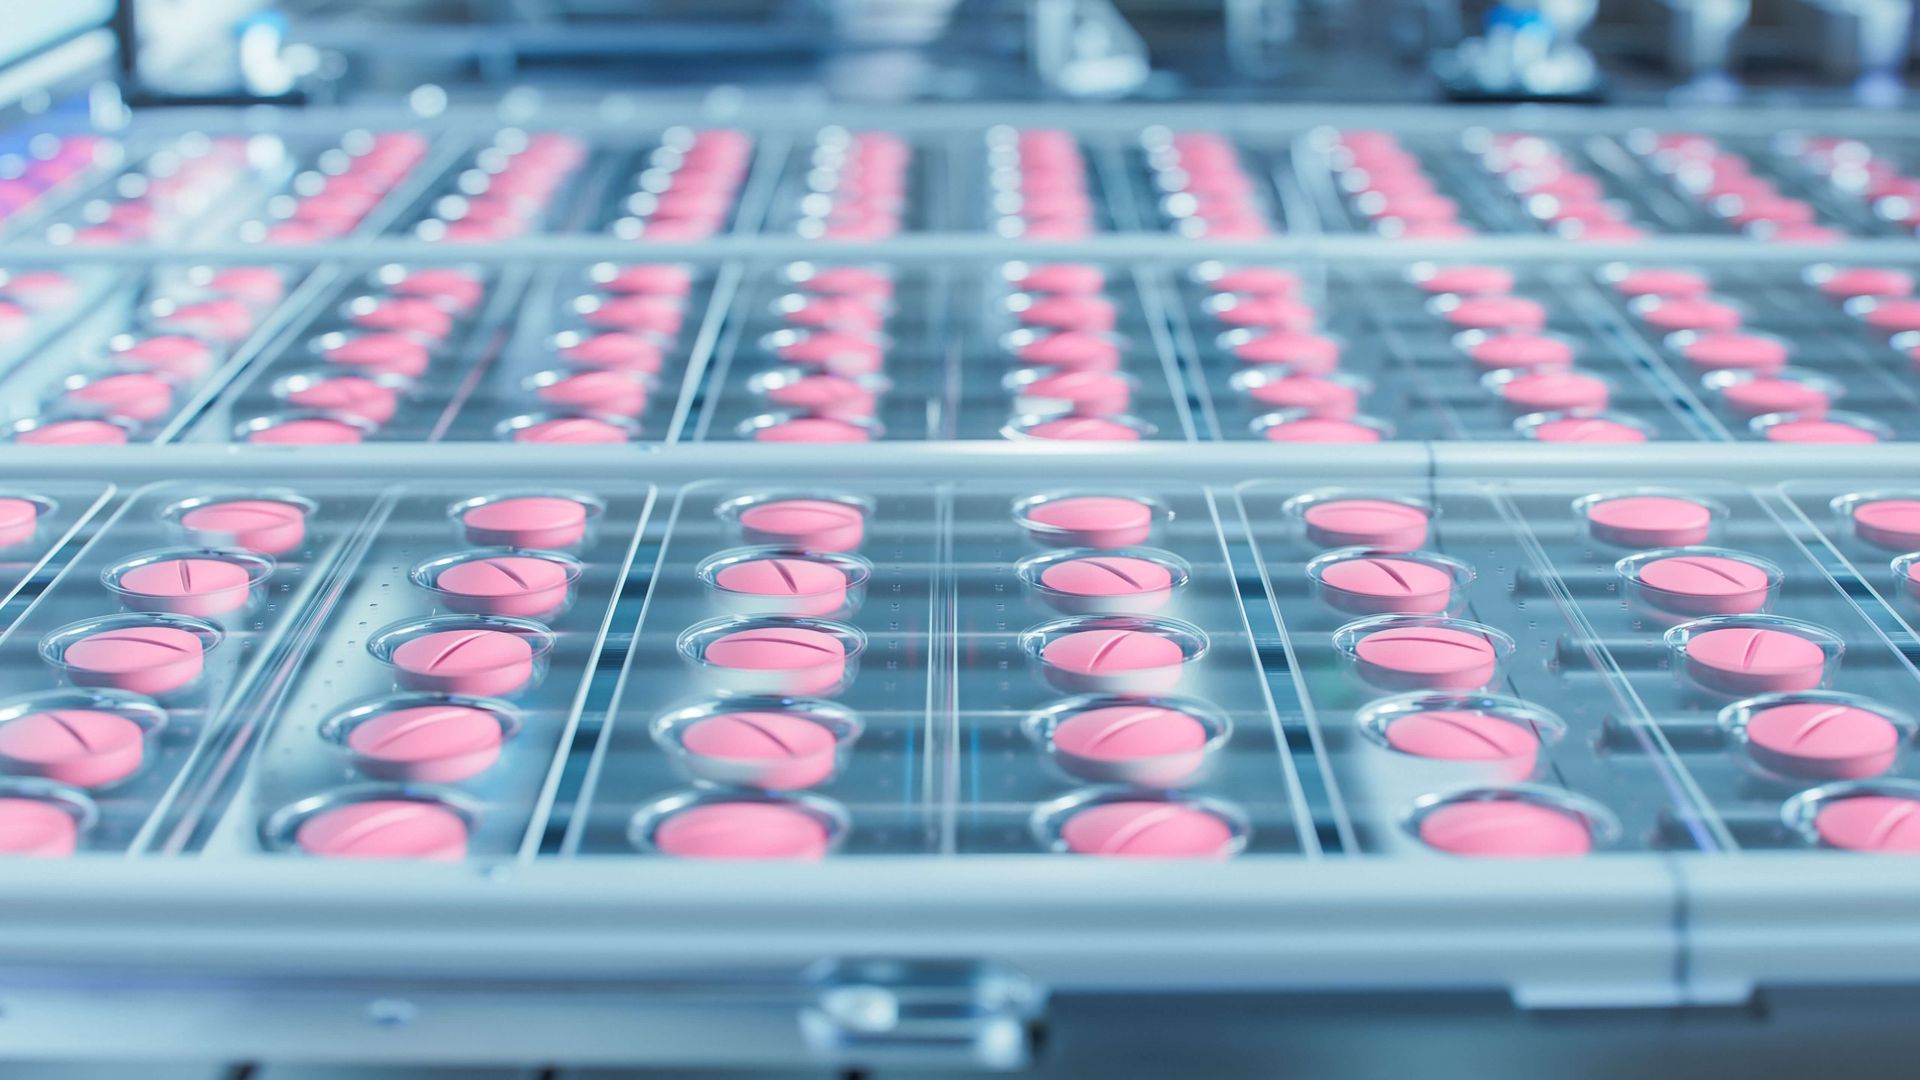
Cleanrooms are critical environments in industries like pharmaceuticals, biotechnology, aerospace, semiconductors, and healthcare, where even minute contamination can compromise product quality, safety, and efficacy. Managing contamination in these controlled environments is paramount for ensuring compliance with regulatory standards, maintaining operational efficiency, and protecting both products and personnel. This article explores best practices for managing cleanroom contamination, providing detailed insights into contamination sources, control strategies, and operational protocols.


1. Understanding Cleanroom Contamination


Contamination in cleanrooms can stem from a variety of sources, including airborne particulates, biological contaminants, chemical residues, and even personnel working within the space. Contaminants are typically classified into two main categories:


  • Particulate Contaminants: Dust, fibers, skin flakes, hair, and equipment-generated particles. Particulates are measured in terms of particle size and concentration.
  • Microbiological Contaminants: Microorganisms such as bacteria, fungi, and viruses. These contaminants can compromise sterile processes, especially in pharmaceutical and biotechnological applications.


Common Contamination Sources:


  • Personnel: The biggest source of contamination in cleanrooms, as human skin sheds cells and hair, while respiratory droplets can release microorganisms.
  • Equipment and Materials: Machinery, tools, and incoming materials can introduce contaminants through wear, shedding, or insufficient cleaning.
  • Airborne Particles: External air can bring in dust, pollen, and other particulates if filtration is inadequate.
  • Process Materials: Solvents, chemicals, and gases used in the cleanroom can sometimes produce by-products that contribute to contamination.


2. Contamination Control Strategies


Effective contamination management in cleanrooms revolves around three key control strategies: Prevention, Minimization, and Mitigation. Let’s explore how these strategies can be applied in practice.


a. Facility Design and Airflow Control


The physical design of the cleanroom is the foundation of contamination control.


  • Air Filtration and Ventilation: Cleanrooms rely on High-Efficiency Particulate Air (HEPA) or Ultra-Low Penetration Air (ULPA) filters to remove particles from the air. HEPA filters can capture 99.97% of particles as small as 0.3 microns, while ULPA filters capture 99.999% of particles as small as 0.12 microns. Proper placement of these filters in the cleanroom’s HVAC system ensures that only clean, filtered air enters the room.
  • Positive Pressure: Maintaining a higher air pressure inside the cleanroom compared to adjacent spaces prevents contaminants from entering. This is particularly crucial for pharmaceutical and medical cleanrooms, where sterility is key. Conversely, negative pressure is used in cleanrooms where hazardous substances need to be contained within the environment.
  • Laminar Flow: Cleanrooms often use laminar airflow systems to direct air in a uniform direction at a constant velocity. This creates a unidirectional airflow that sweeps particles away from critical areas, minimizing contamination risks.
  • Air Change Rates (ACR): Cleanrooms typically experience multiple air changes per hour (ACH) to dilute and remove contaminants. Depending on the cleanroom class, the ACR can range from 30 to over 600 changes per hour. The appropriate ACR helps maintain a stable and clean environment.


b. Personnel Protocols and Hygiene Practices


Since personnel are the largest source of contamination, stringent protocols are essential to mitigate contamination risks.


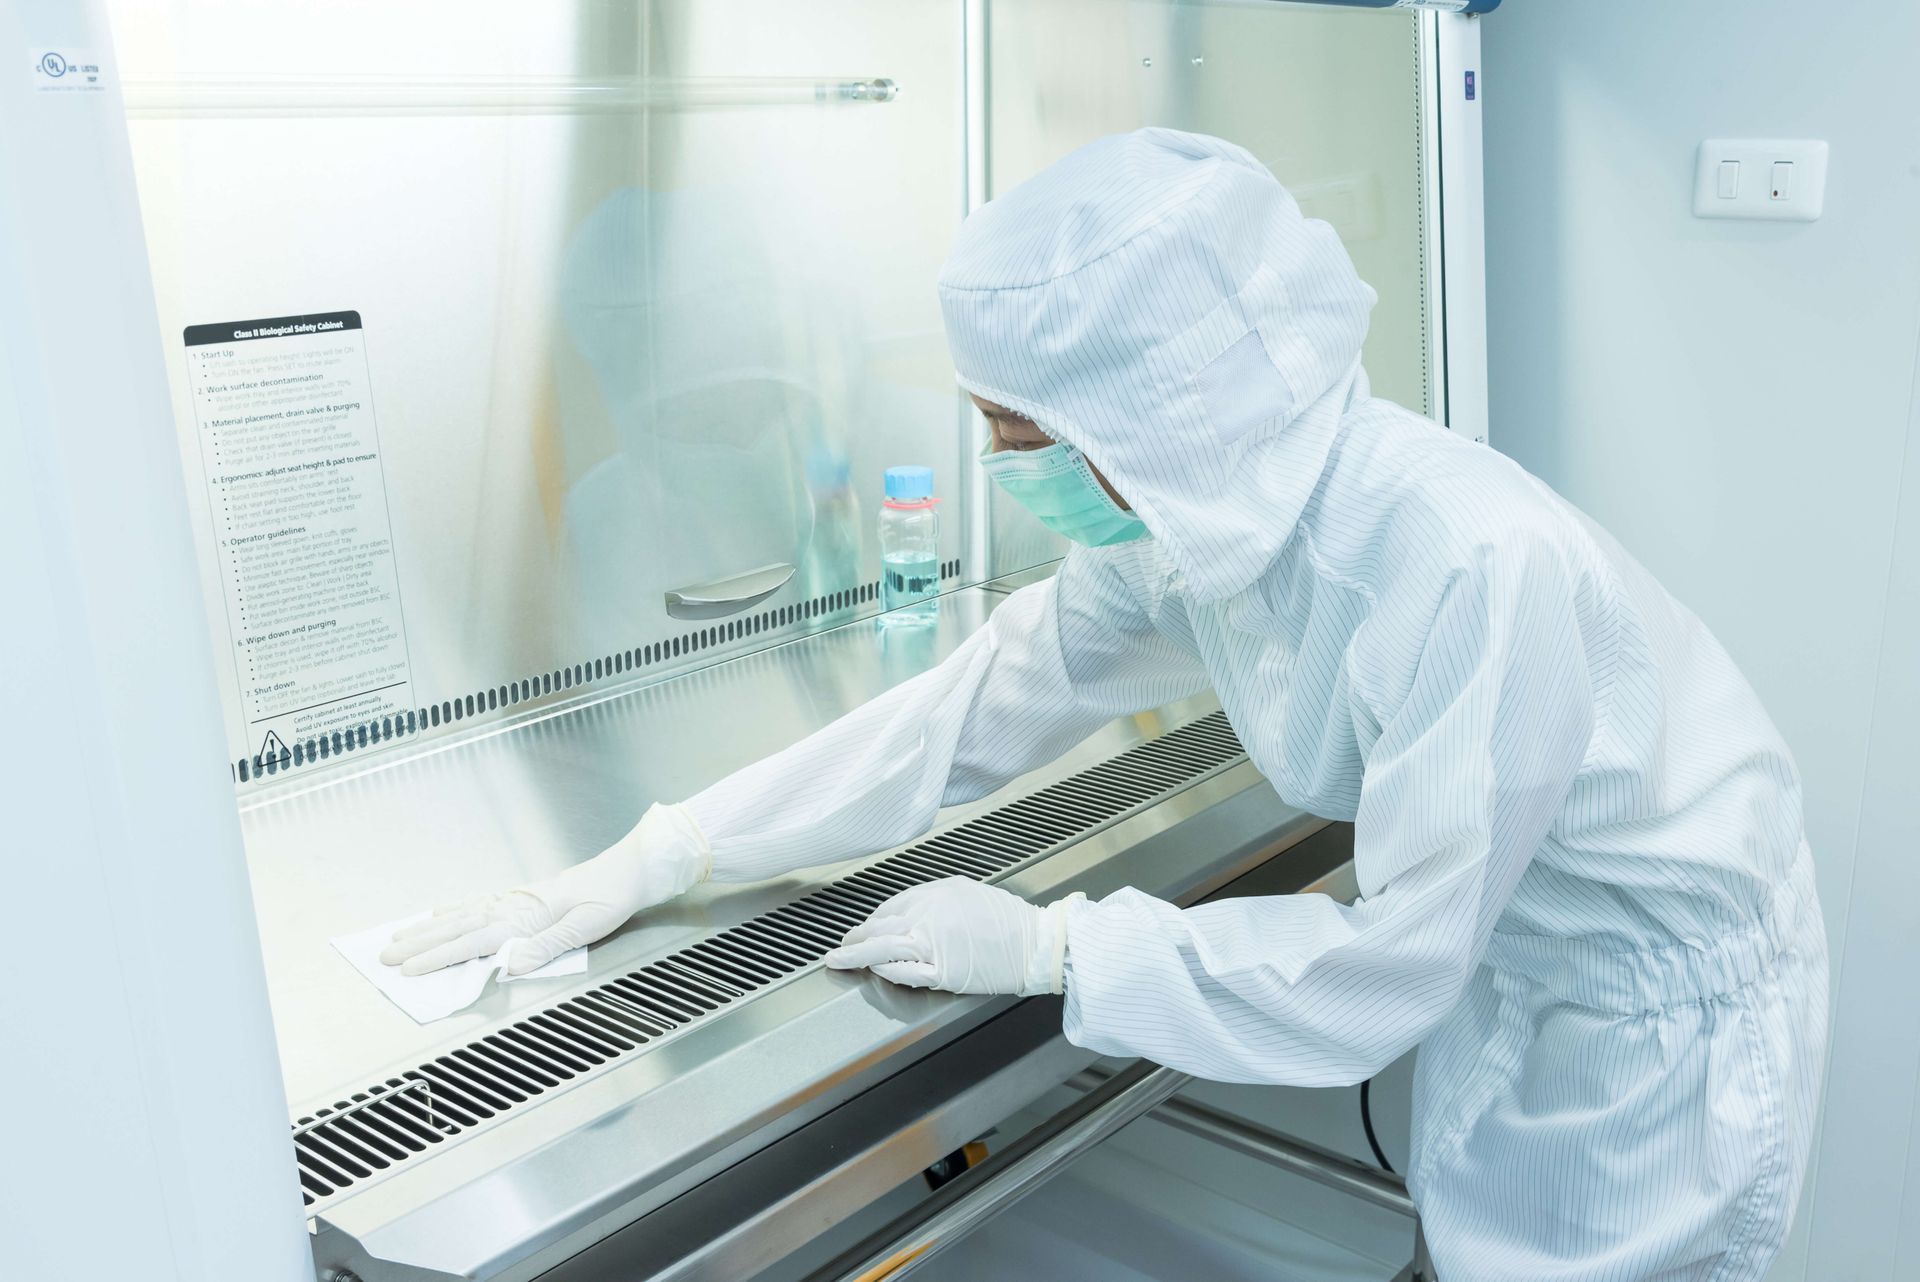
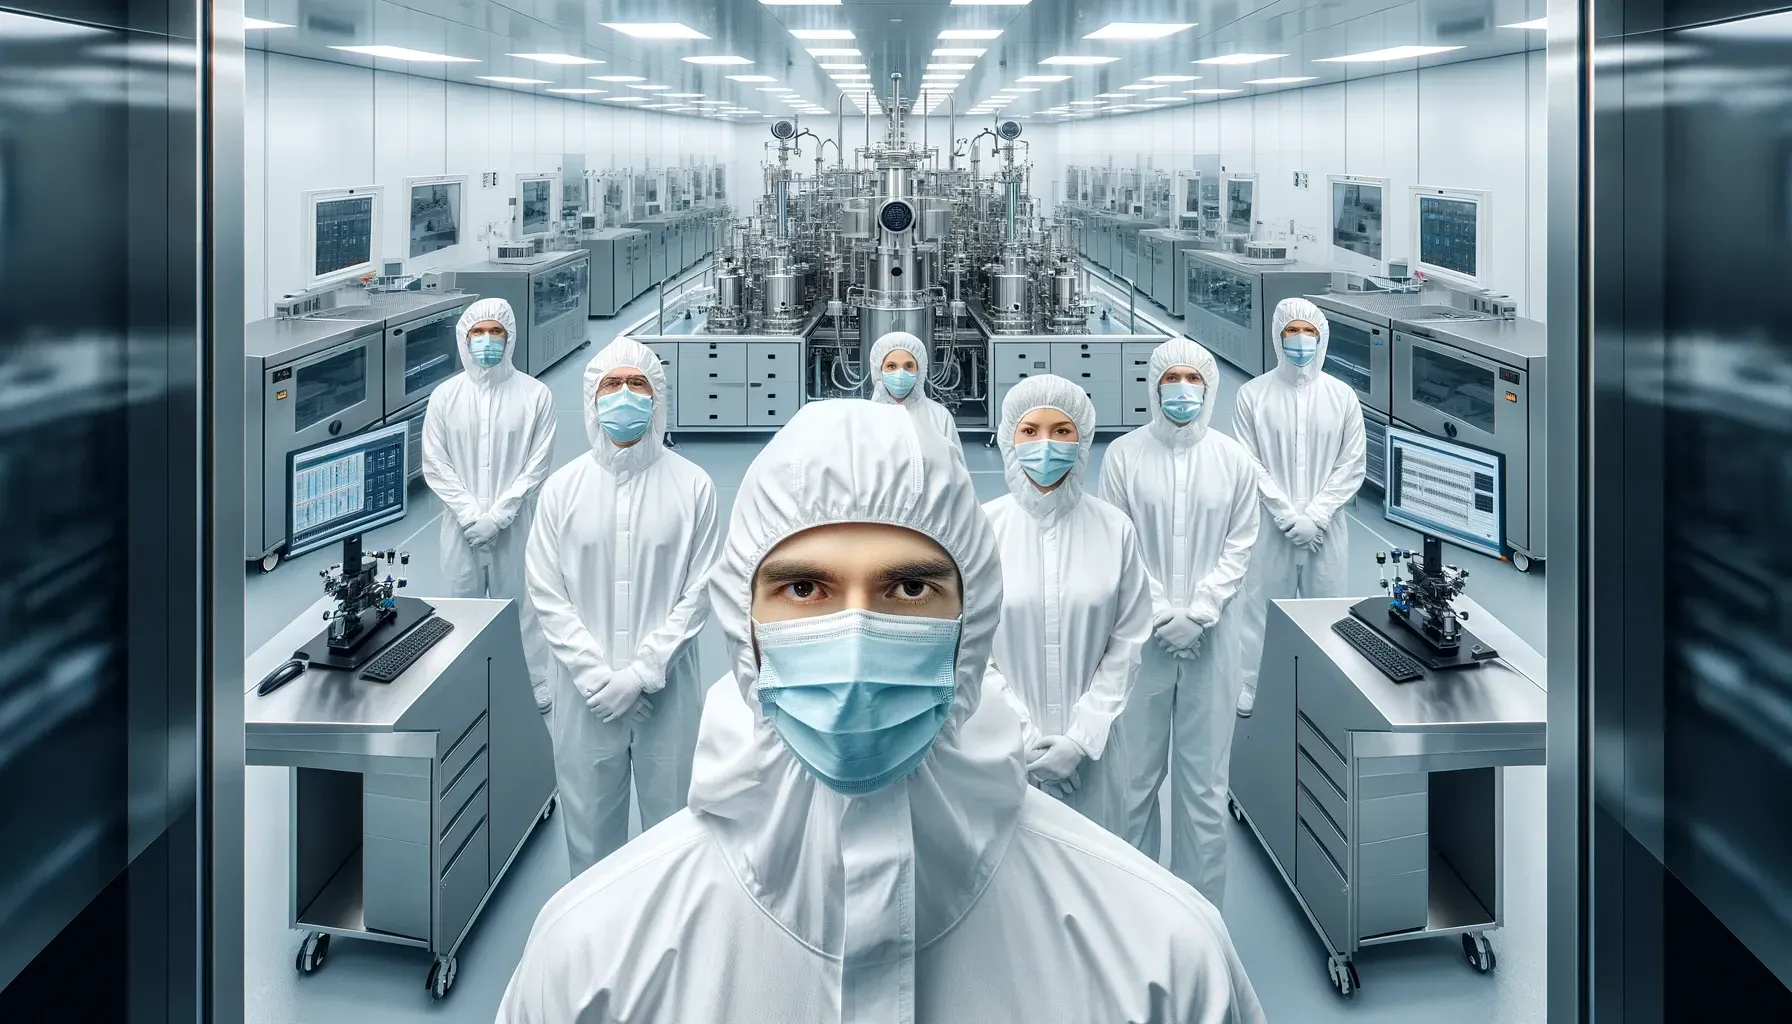
  • Gowning Procedures: Proper gowning is essential to minimize skin and hair shedding. Personnel entering the cleanroom must follow a step-by-step gowning procedure, which includes donning sterile suits, gloves, face masks, shoe covers, and sometimes full-face respirators. These garments should be made from non-linting materials to reduce particle shedding.
  • Hand Hygiene: Before entering the cleanroom, personnel must thoroughly wash and sanitize their hands to remove potential contaminants. This reduces microbial contamination that could be transferred to gloves.
  • Training and Behavior Protocols: Personnel should receive extensive training on proper cleanroom behavior, including minimizing movement, avoiding touching surfaces, and restricting unnecessary conversation. This is critical to reduce particle dispersion.
  • Controlled Access: Limiting access to the cleanroom to only trained and authorized personnel helps reduce the overall contamination load.


c. Material and Equipment Handling


The way materials and equipment are handled in a cleanroom significantly impacts contamination levels.


  • Cleaning and Disinfection: All equipment entering the cleanroom must be thoroughly cleaned and, if required, sterilized. Disinfectants should be carefully chosen based on their efficacy against specific contaminants (e.g., sporicidal agents for bacterial spores). Regular disinfection schedules must be adhered to, and surfaces should be frequently wiped down to remove residues and particles.
  • Material Transfer Protocols: Items should be transferred into the cleanroom via airlocks or pass-through systems, where they are cleaned, wiped, or decontaminated before entry. Packaging materials should be kept to a minimum, as they can introduce fibers and particles.
  • Minimizing Equipment Movement: Moving equipment or materials within the cleanroom can stir up contaminants. Wherever possible, fixed workstations should be used to reduce unnecessary equipment movement.


d. Environmental Monitoring


Routine monitoring of the cleanroom environment is essential to ensure compliance with cleanliness standards and identify potential contamination

risks early.


  • Particle Counting: Automated particle counters are used to measure the concentration of airborne particles. Continuous monitoring ensures that particle levels remain within specified limits for the cleanroom class (e.g., ISO Class 5, 6, 7).
  • Microbial Monitoring: Settling plates, swabs, and contact plates can be used to assess microbial contamination on surfaces and in the air. Regular testing helps detect potential contamination breaches, particularly in sterile environments.
  • Temperature and Humidity Control: Maintaining appropriate temperature and humidity levels is vital for minimizing particle aggregation and preventing microbial growth. Excess moisture can promote mold and bacterial growth, while static electricity buildup from low humidity can attract dust and other particles.


3. Best Practices for Cleanroom Contamination Management


Here are consolidated best practices to ensure robust contamination control in cleanrooms:


a. Adherence to Cleanroom Classification Standards


Cleanrooms are classified based on the number and size of particles allowed per cubic meter of air, as specified by standards like ISO 14644. Regular validation and requalification of cleanroom performance (e.g., particle counts, airflow, pressure differentials) ensure continued compliance with these standards. This validation should be performed following any significant maintenance, repair, or change in operation.


b. Regular and Thorough Cleaning Protocols


Scheduled cleaning protocols should cover all surfaces (walls, floors, ceilings), workstations, and equipment in the cleanroom. Cleaning should be done with approved, low-shedding materials like lint-free wipes, and disinfectants should be rotated to prevent microbial resistance.


  • Cleaning Tools: Use non-shedding mops and wipes made from microfiber or polyester materials that minimize particle generation. Avoid using tools that can harbor contaminants, like cotton or cellulose-based materials.


c. Environmental Controls for Critical Zones


Critical areas where contamination control is paramount, such as around product filling lines or exposed materials, should have stricter controls. These may include higher levels of HEPA filtration, increased airflow rates, and more stringent gowning requirements. Additionally, monitoring should be more frequent in these zones.


d. Waste and Disposable Management


Waste materials must be regularly removed from the cleanroom, and disposable items like gloves, wipes, and gowns should be used efficiently and discarded appropriately. Segregating waste into different categories (e.g., biological, chemical) helps reduce contamination risks.


e. Contamination Incident Response Plans


Having a well-documented response plan for contamination events (e.g., microbial breaches, equipment failure) is essential. This should include immediate steps for containment, root cause investigation, corrective actions, and preventative measures to avoid recurrence. All incidents should be thoroughly documented for audit purposes.


4. Technology and Innovations in Cleanroom Contamination Control


Advancements in technology are continuously improving cleanroom contamination management. Some emerging trends include:


  • Robotics and Automation: Automated systems for material handling, disinfection, and environmental monitoring reduce human interaction and, therefore, contamination risks.
  • Wearable Technology for Monitoring Personnel: Smart garments that monitor the behavior of personnel (e.g., movement, time spent in the cleanroom) can help in understanding contamination trends and identifying areas for improvement.
  • Improved Filtration Systems: HEPA and ULPA filtration technology is evolving to provide better efficiency and longevity, while innovations in nanotechnology offer potential for advanced contamination control solutions at the molecular level.


Conclusion


Managing cleanroom contamination is a complex, multifaceted process that requires adherence to stringent protocols, the implementation of advanced technologies, and a culture of cleanliness and discipline. By focusing on facility design, personnel protocols, material handling, environmental monitoring, and continuous improvement, industries can maintain the necessary levels of cleanliness to ensure product integrity, regulatory compliance, and operational success. In industries where precision and sterility are paramount, the effective management of cleanroom contamination is not just a best practice—it is a critical necessity.


Read more:  All About Cleanrooms - The ultimate Guide


Person in cleanroom suit examines a silicon wafer under a microscope in a laboratory.
By Kjeld Lund April 17, 2026 April 17, 2026
Implementing Real-Time Viable Particle Monitoring Technologies 1. Introduction Real-time viable particle monitoring technologies are moving from “interesting innovation” to serious design option in modern aseptic facilities. EU GMP Annex 1’s increased focus on continuous monitoring, rapid detection, and robust trending has triggered renewed interest in systems capable of providing near real-time indication of microbiological contamination , rather than waiting days for incubation results. This article outlines practical, engineering-focused approaches to implementing real-time viable monitoring in ISO-classified areas, with emphasis on technology limitations, integration into existing environmental monitoring (EM) programs, and alignment with contamination control strategies (CCS). 2. Understanding Real-Time Viable Monitoring Technologies Unlike conventional EM (active air sampling, settle plates, contact plates), real-time viable systems attempt to distinguish biological from non-biological particles as they pass through an instrument. Common technology principles include: Biofluorescent particle counters (BFPC): Particles are illuminated by one or more lasers. Optical scattering gives size information; autofluorescence (from NADH, riboflavin, etc.) is used as a surrogate for “viable/biological.” Flow-cytometry-based systems: Particles are stained with fluorescent dyes and passed single-file through a detection zone. More complex, generally used in off-line or at-line applications. Integrated hybrid systems: Combine non-viable counting with biofluorescence to provide simultaneous total and “viable-like” counts in the same sample stream. Important: these systems do not provide organism identification and do not fully replace traditional culture-based methods. They provide fast indication of changes in biological load , useful for process control and early warning. 3. Regulatory and CCS Context EU GMP Annex 1 and ISO 14644-2 do not mandate specific technologies, but they do expect that monitoring strategies are: Risk-based and science-driven . Capable of detecting unusual events and supporting rapid response. Integrated into a Contamination Control Strategy (CCS) . Real-time viable systems can support these expectations by: Providing continuous or high-frequency data in Grade A and critical Grade B zones. Improving visibility during high-risk operations, set-ups, and interventions. Enhancing investigations of EM excursions or media fill failures. However, regulators expect that any such technology is formally validated , its limitations understood , and its role clearly defined alongside traditional EM —not as a black-box replacement. 4. Defining Objectives: Why Do You Want Real-Time Viable Data? Before selecting equipment, define clear objectives. Common drivers include: Early warning capability in Grade A/RABS/isolators during filling or aseptic manipulations. Enhanced understanding of how interventions and equipment states influence viable load. Continuous monitoring of normally difficult-to-sample locations (inside isolators, at critical transfer points). Support for process optimization , e.g., comparing different line speeds, set-up sequences, or intervention techniques. Each objective should map to: Specific locations (e.g., filling needle zone, stopper bowl, transfer ports). Specific process steps or risk scenarios. Defined decisions (what actions will you take when the system alarms?). Without clear objectives and decision rules, the system will generate large amounts of data but little actionable value. 5. Designing the System and Selecting Locations Location strategy should combine: Risk assessments (CCS, FMEA, HACCP-style reviews). Airflow visualization studies (smoke studies) to identify where particles reaching the product are most likely to originate. Existing EM data , especially past excursions or persistent “weak spots.” Practical design rules: Prioritize Grade A critical zones : directly above open containers, filling needles, open transfer points, stopper bowls. For isolators, consider in-chamber sampling in the main aseptic workspace, not just background. For RABS, pay attention to interaction zones (glove ports, open-front zones, component loading points). Avoid sampling points too close to HEPA outlets or returns where flow may not be representative of what the product “sees.” Sampling flow rates, tubing length, and bends must be designed according to manufacturer recommendations to avoid particle losses and false trends. 6. Integration with Existing EM Programs Real-time viable monitoring should be embedded , not bolted-on, to the facility’s EM concept. Key integration points: Complement, don’t replace, plates: Traditional active air and surface sampling remain necessary for identification and trend continuity . Real-time systems are typically defined as additional, rapid-indication tools . Harmonize locations: Wherever practical, align real-time sampling heads with existing EM locations so that data can be correlated. Sampling strategy: Real-time devices run continuously (or at high duty cycles) in defined windows (e.g., entire fill). Culture-based samples are taken at defined points (start, middle, end, interventions), providing confirmatory and ID data. The updated EM plan should show how data streams interact , what each is used for, and how they jointly satisfy Annex 1 expectations. 7. Qualification and Validation Strategy Implementing real-time viable monitoring requires a structured qualification approach similar to other GMP-critical systems. Typical qualification elements: DQ (Design Qualification): Justification of chosen technology. Definition of locations, interfaces, sampling rates, and data handling. IQ (Installation Qualification): Verification of correct installation, materials of construction, tubing routing, and environmental compatibility. Calibration status and certificates for flow, laser power, and sensors. OQ (Operational Qualification): Functionality tests across operating ranges (flow, counting range, alarm logic). Verification of signal stability, repeatability, and response to standard test aerosols. Method validation / performance characterization: Correlation studies vs. conventional active air sampling under controlled challenge conditions. Evaluation of false positive/negative rates (e.g., non-biological fluorescence, under-detection of low emitters). Determination of system detection limit and dynamic range. Documentation should clearly describe how “viable-like” counts are defined , including any thresholds, signal processing, and classification logic used by the system. 8. Establishing Alarm Limits and Response Criteria Unlike traditional EM, real-time systems can generate hundreds or thousands of data points per batch. Alarm strategy must be carefully designed. Key steps: Baseline studies: Operate the system over multiple representative batches under “good” conditions to build a baseline distribution. Segment data by operation phase (set-up, steady filling, interventions, shutdown). Define alert and action levels: Use statistical evaluation (e.g., percentiles) as a starting point. Adjust based on risk of the operation and tolerance for false alarms. Time-based rules: Consider alarms based on sustained elevations over defined intervals, not single spikes, to avoid overreaction to transient non-critical events. Link to procedures: Define specific actions (e.g., check gown, verify HEPA face velocity, pause line, increase observation, initiate investigation). Ensure that alarm responses are practical , otherwise operators will rapidly lose trust in the system. As experience grows, alarm limits can be refined using accumulated trending data. 9. Data Management, Trending, and Integration with CCS Real-time viable systems generate large data volumes that must be handled in a compliant, meaningful way. Considerations: Data integrity: Audit trails, time synchronization, user access control, secure storage, and backup. Alignment with data integrity principles (ALCOA+). Visualization and reporting: Dashboards that overlay viable-like counts with line states (stops, interventions), HVAC status, pressure, and non-viable particle counts. Trend analysis: Identification of recurring patterns (e.g., specific interventions always causing spikes). Use of trend data in CCS reviews and continuous improvement activities. Deviation support: Ability to retrieve and review time-synchronized real-time data to support investigations of EM excursions, media fill failures, or sterility test failures. The CCS should explicitly describe how real-time data are used in risk management and continuous improvement , not just that they exist. 10. Practical Challenges and Limitations Real-time viable monitoring offers significant potential, but also carries limitations that must be acknowledged. Common challenges: Specificity: Biofluorescence is an indirect marker; some non-biological particles fluoresce and some damaged microorganisms may not. Quantitative comparability: Results may not be directly comparable to “cfu/m³”; they are often reported as “biological particle counts” and must be interpreted accordingly. Instrument sensitivity to environment: Vibration, temperature swings, and condensation can affect performance. Maintenance and contamination: Systems can themselves become contaminated; maintenance and cleaning procedures must be defined and validated. Regulatory familiarity: Inspectors may be cautious if the technology appears to “replace plates.” Clear positioning within the EM program is essential. Being transparent about these limitations in validation reports and CCS discussions builds confidence and avoids unrealistic expectations. 11. Lifecycle Management and Periodic Review Once implemented, real-time viable monitoring must be managed over the full lifecycle. Key lifecycle activities: Periodic performance checks: Routine system suitability tests (e.g., defined aerosol challenge) at defined intervals. Calibration and preventive maintenance: As per manufacturer recommendations and internal procedures, with full documentation. Periodic data review: At least annual review of trends, alarm frequency, false positive/negative patterns, and correlation with traditional EM. Change control: Any modification in sampling location, software version, classification algorithms, or integration must undergo formal impact assessment and revalidation where needed. Continuous improvement: Use insights from real-time data to refine interventions, gowning, layout, and airflow conditions. These activities should be integrated into the site’s quality system and linked to the CCS review cycle. 12. Conclusion Real-time viable particle monitoring technologies provide powerful new visibility into microbiological risk in critical cleanroom zones. When implemented with clear objectives, robust validation, well-designed alarm strategies, and tight integration into the EM program and CCS, they can significantly enhance contamination control and support Annex 1 expectations for continuous, risk-based monitoring. However, success depends on engineering discipline and realistic expectations : these systems are best used as enhanced detection and diagnostic tools , not as simple replacements for culture-based monitoring. Facilities that understand and manage both the strengths and limitations of real-time viable monitoring will be well positioned to operate safer, more robust aseptic processes in the years ahead. Read more here: About Cleanrooms: The ultimate Guide
Person in a cleanroom suit cleaning the ceiling with a long-handled tool in a sterile room with yellow doors.
By Kjeld Lund April 10, 2026 April 10, 2026
Qualification of Isolators and RABS: Methods and Acceptance Criteria 1. Introduction Isolators and Restricted Access Barrier Systems (RABS) are now central to modern aseptic processing, reflecting the expectations of EU GMP Annex 1 for minimizing direct operator intervention in Grade A environments. Their qualification must demonstrate not only ISO 14644 compliance, but also robust containment, airflow protection, and integration into the site’s Contamination Control Strategy (CCS). This article provides a structured, engineering-focused overview of qualification methods and acceptance criteria for isolators and RABS, aligned with DQ–IQ–OQ–PQ lifecycle principles. 2. Role of Isolators and RABS in Aseptic Processing Both technologies create a physical and aerodynamic barrier between operators and critical aseptic processing zones: Closed isolators : Typically fully enclosed, operated under positive or negative pressure with integrated bio-decontamination (e.g., VHP). Open or closed RABS : Provide a rigid barrier with glove ports and defined openings; may rely on surrounding cleanroom conditions and airflow. Qualification must prove that the barrier system: Maintains Grade A conditions at critical points. Minimizes risk from interventions and glove operations. Integrates with background Grade B/C areas and HVAC systems without compromising protection. 3. Lifecycle Framework: DQ–IQ–OQ–PQ for Barrier Systems Barrier technologies should follow the same lifecycle approach as cleanrooms but with additional emphasis on containment and glove interface performance. DQ (Design Qualification) Justification for isolator vs. RABS selection. Airflow concept (unidirectional/mixed, air change rates, pressure differentials). Bio-decontamination concept for isolators. Integration with filling lines, conveyors, stoppers, or other process equipment. IQ (Installation Qualification) Verification of materials, seals, viewing panels, glove ports, transfer hatches. Installation of HEPA filters, ductwork, fans, VHP generators, sensors. Utilities and interfaces (power, compressed air, data, automation). OQ (Operational Qualification) Airflow, pressure, control logic, alarms, and decontamination cycles tested against defined specifications. PQ (Performance Qualification) Demonstration that the system performs as required under real or simulated aseptic operations (including media fills). 4. Cleanroom Integration and Zoning The performance of isolators and RABS depends strongly on their environment. Key design and qualification aspects: Background classification Typically Grade B for open RABS, sometimes Grade C for closed/advanced systems where justified. Airflow and pressure differentials between barrier and background must be defined and verified. Pressure regime Positive pressure isolators for product protection. Negative pressure isolators for containment of potent or hazardous products, with suitable secondary protection. Airflow interaction For RABS, background ceiling HEPA and local unidirectional flow must be synchronized to avoid cross-drafts and loss of protection at openings. IQ/OQ must explicitly confirm that the integrated system performs according to this zoning concept. 5. HEPA/ULPA Filtration and Airflow Qualification Air cleanliness and airflow are fundamental to barrier qualification. Core tests and methods (typically OQ): HEPA/ULPA filter integrity testing Aerosol challenge (e.g., PAO/DEHS) of each supply and exhaust filter and its housing. Acceptance: No leaks above specified local penetration; overall leakage within defined limits. Airflow pattern verification Airflow visualization (“smoke studies”) within the isolator/RABS chamber and at openings. Confirmation of unidirectional flow over critical points and absence of backflow from operator side. Air velocity and uniformity Measurement at working height across critical zones. Acceptance: Within design range (e.g., 0.36–0.54 m/s for UDAF, or as justified) with acceptable uniformity and no dead zones. Air change rate (for non-unidirectional areas) Calculated based on measured flows; must meet design and contamination control targets. These tests must be documented with clear maps, measurement grids, and comparison to design criteria. 6. Pressure Control and Containment Performance Pressure regimes must ensure directional flow from “clean” to “less clean” (or vice versa for containment systems). Key qualification elements: Internal pressure stability Setpoint verification at multiple operation modes (idle, production, doors opening/closing). Acceptance: Differential pressures within specified limits (e.g., minimum 10–15 Pa vs. background, or as per risk assessment). Door and hatch operation Transient pressure behaviour during door/hatch cycles for material and component transfers. For RABS with controlled openings, verification that openings do not reverse flow. Glove port influence Smoke studies and pressure logging with glove movements to confirm maintenance of inward or contouring flow. Containment tests (for negative pressure or toxic products) May include tracer gas or particle containment studies according to biosafety or occupational exposure standards. All acceptance criteria should be traceable to the CCS and occupational hygiene requirements. 7. Bio-Decontamination and Cycle Validation (Isolators) For isolators with automated bio-decontamination (commonly VHP), cycle qualification is critical. Typical validation activities: Distribution mapping Placement of chemical indicators and biological indicators (BIs) at worst-case locations (shadowed areas, complex geometry, long hoses, under equipment). Demonstration of adequate concentration and contact time throughout the chamber. Kill performance BIs containing resistant spores (e.g., G. stearothermophilus) exposed during the cycle. Acceptance: ≥ 6-log reduction (or as defined in URS and risk assessment) at all test locations. Cycle robustness Testing variability in load patterns (minimum/maximum load), temperature/humidity, and start-up conditions. Establishing operating ranges and critical parameters (e.g., injection rate, dwell time, aeration). Aeration and residuals Verification that residual H₂O₂ or other agents fall below defined limits before aseptic operations or operator exposure. Validated decontamination cycles must be locked into control logic with change control for any parameter modification. 8. Particle and Microbial Qualification (At-Rest and In-Operation) Environmental qualification must demonstrate that the barrier system can consistently achieve and maintain required classifications. Particle qualification: At-rest tests Particle counts at critical locations with equipment installed but not operating and no operators present. Acceptance: Conformity with ISO class corresponding to Grade A (e.g., ISO 5) at specified sample volumes. In-operation tests Particle counts during typical operations, including worst-case interventions and maximum staffing for RABS. For isolators, conducted with gloves in use, doors in normal operation mode, and machinery running. Microbial qualification: Non-viable / viable link Use settle plates, contact plates, and active air sampling at locations justified by smoke studies and risk assessment. Baseline PQ studies Initial campaigns to establish normal microbial levels and demonstrate compliance with Annex 1 limits for Grade A/B zones. Acceptance criteria and alert/action limits must be clearly defined and linked to EM programs. 9. Glove System Qualification and Lifecycle Control Gloves are a key risk point and deserve dedicated qualification focus. Key elements: Material selection and compatibility Chemical and mechanical resistance to cleaning agents, VHP, and process contact. Glove leak testing Routine integrity testing (e.g., pressure hold, water column, automated test systems). Defined frequency (e.g., per campaign, per batch, or per defined interval) and criteria for rejection. Installation and replacement Qualification of glove change procedures to avoid contamination ingress. Smoke visualization of glove change ports where applicable. Lifecycle monitoring Trending of glove failures, root cause analysis, and improvement actions. Glove-related acceptance criteria must be integrated into operational SOPs and media-fill design. 10. Media Fills and Process Simulation (PQ) Performance Qualification must demonstrate that the isolator or RABS supports robust aseptic processing. Media fill design should: Include worst-case interventions specific to barrier systems: Glove manipulations, door openings (where allowed), component replenishment through RABS doors, stopper bowl interventions, etc. Simulate maximum routine operating times , line speeds, and staffing. Reflect normal and abnormal but plausible conditions , as defined in the CCS. Acceptance criteria typically follow Annex 1 expectations (e.g., zero contaminated units for high-volume sterile fills), with failures driving investigation of barrier integrity and airflow protection. 11. Documentation, Change Control, and Requalification Barrier system qualification must be supported by comprehensive documentation: URS, DQ reports, and risk assessments. IQ/OQ/PQ protocols and reports covering all tests described above. Calibration records for sensors (pressure, temperature, humidity, particle counters). Bio-decontamination validation reports (for isolators). Smoke study videos and interpretation reports. Media-fill protocols and evaluation reports. Requalification typically includes: Annual HEPA integrity testing and airflow verification. Periodic re-verification of bio-decontamination cycles. Regular glove integrity program review. Smoke studies following layout, equipment, or parameter changes. Reassessment of particle and microbial performance based on EM trends. Any design or critical parameter changes must pass through formal change control with impact assessments. 12. Conclusion Qualification of isolators and RABS requires a rigorous, lifecycle-based approach that integrates airflow performance, pressure control, filtration, decontamination capability, glove integrity, and process simulation. By defining clear, risk-based acceptance criteria and linking all tests to the facility’s CCS and regulatory expectations, organizations can demonstrate that their barrier systems provide robust, repeatable protection of aseptic processes. Executed correctly, barrier qualification not only satisfies EU GMP Annex 1 and ISO 14644 requirements, but also delivers tangible reductions in contamination risk and greater confidence in the long-term performance of critical sterile manufacturing operations. Read more here: About Cleanrooms: The ultimate Guide
Robotic arms assembling circuit boards on a factory production line.
By Kjeld Lund April 1, 2026 April 1, 2026
Smoke Visualization Studies: Interpreting Airflow Behaviour in Critical Zones 1. Introduction Smoke visualization—often referred to as airflow visualization or “smoke studies”—is a core diagnostic tool for assessing airflow behaviour in cleanrooms, particularly within critical Grade A/B aseptic processing zones . EU GMP Annex 1 explicitly requires airflow visualization both at rest and in operation to demonstrate that unidirectional flow adequately protects critical operations, equipment, and product-contact surfaces. This article provides a technically grounded, engineering-focused guide to designing, executing, and interpreting smoke studies to ensure airflow patterns support contamination control and meet regulatory expectations. 2. Purpose and Regulatory Expectations Smoke visualization aims to confirm that airflow behaves as intended, ensuring protection of critical environments by identifying disturbances, dead zones, or reverse flow patterns. Annex 1 requirements include: Demonstrating unidirectional airflow in critical zones with no entrainment of contamination. Showing that interventions, equipment placement, and operator activities do not compromise flow. Recording and documenting both normal operations and “worst-case” conditions. Using visualization outcomes to justify environmental monitoring (EM) locations and risk assessments. Regulators increasingly expect high-quality, well-lit, high-frame-rate video evidence supported by engineering analysis. 3. Principles of Smoke Visualization Smoke studies rely on neutrally-buoyant or near-neutrally-buoyant aerosol streams to reveal airflow direction, turbulence, and obstruction effects. Key principles: Laminarity assessment: Evaluating whether airflow remains uniform and downward across critical surfaces. Turbulence identification: Detecting vortices, backflow, eddies, and stagnation zones. Flow continuity: Ensuring that HEPA-supplied air reaches and sweeps over all areas requiring protection. Disturbance analysis: Assessing how operator movements or equipment operations interrupt airflow. Smoke should follow airflow faithfully without excessive momentum, allowing true visualization of local flow patterns. 4. Smoke Generation and Equipment Selection Selecting appropriate smoke sources is critical to obtaining reliable, interpretable results. Preferred smoke generation systems: Glycol- or glycerin-based theatrical foggers: Provide consistent particle size and visibility. Aqueous-based foggers: Useful where low residue is essential. CO₂-powered smoke sticks or pens: Suitable for small, localized studies but less uniform for large areas. Selection criteria include: Particle size distribution that mimics local airflow without premature settling. Sufficient output to visualize flow while avoiding room overloading. Non-toxic, non-reactive, low-residue formulations compatible with critical areas. Systems must be validated to avoid false interpretation caused by heavy, buoyant, or heat-driven smoke sources. 5. Study Design and Protocol Development A robust smoke study begins with a well-defined protocol linked to the URS, CCS, and DQ rationale . Protocol elements should include: Objectives and acceptance criteria: Clear definitions of expected airflow behaviour. Locations and scenarios: Critical zones (e.g., filling needles, stopper bowls, conveyors). Operator interventions (e.g., aseptic connections, glove port movements). Start-up, steady-state, and operational disturbances. Equipment and material layout: Configured to reflect real or worst-case operating conditions. Airflow setpoints and system parameters: Confirmed and documented before testing. Camera setup: High-resolution, appropriate lighting, multiple angles. Worst-case planning must consider maximum equipment load, maximum personnel presence, and intervention frequency. 6. Executing Smoke Visualization in Unidirectional Flow Zones Critical Grade A areas require consistent downward unidirectional airflow. Smoke studies should show: Smooth, vertical flow lines from HEPA/ULPA filters to the work surface. Minimal turbulence around critical operations such as open product containers. Absence of upward or lateral entrainment that could draw contamination toward sterile items. No stagnation zones behind equipment or within recesses where particles may accumulate. Effective sweeping across entire working surfaces with smoke exiting through low-level returns. Any deviations must be analysed and either justified or rectified through engineering changes. 7. Evaluating Airflow in Barrier Systems (RABS and Isolators) RABS and isolators rely on highly controlled local airflow. Smoke studies must confirm: Integrity of airflow curtains around glove ports and open interventions. Clear separation between operator activities and product flow paths. Protection of transfer zones , particularly during rapid hatch cycling. Absence of backflow when gloves move or during equipment actuation. Isolators may require visualization under both positive and negative pressure, depending on application. 8. Assessing Turbulent-Mixed Airflow Areas In ISO 7–8 backgrounds, smoke visualization is used to: Identify recirculation zones generated by equipment, columns, or heat loads. Confirm airflow direction toward returns and absence of zones where particles may accumulate. Evaluate interactions with operators , especially in high-traffic spaces. Validate airflow behaviour at material transfer points, door operations, and airlocks. This analysis supports risk assessments and informs EM location justification. 9. Interpreting Disturbances and Flow Anomalies Interpretation requires technical competence and a structured approach. Common anomalies include: Eddies behind equipment: Indicate need for repositioning or airflow balancing. Upward thermal plumes above heat sources or operator positions. Cross-drafts from cooling units, door leakage, or improper FFU balancing. Flow “shadowing” caused by improperly placed equipment or tall containers. Jetting from supply diffusers in turbulent areas, creating turbulence at working height. Each anomaly must be assessed for contamination risk and documented with potential mitigations. 10. Linking Smoke Study Results to Risk Assessment Smoke findings must directly support the facility’s Contamination Control Strategy (CCS) and risk assessments. Practical integration includes: Determining environmental monitoring locations based on turbulence zones. Justifying operator positions and movements during aseptic operations. Supporting airflow-related deviation assessments , such as pressure excursions or EM trends. Informing equipment placement , shield design, and layout modifications. Validating worst-case media-fill design , including intervention scenarios. Regulatory reviewers expect clear traceability from smoke visualization to risk controls. 11. Documentation, Video Quality, and Reporting High-quality documentation is essential for regulatory acceptance. Best practices: Use high-resolution video with stable lighting and minimal glare. Capture each scenario from multiple angles , including close-ups of critical points. Provide annotated stills showing key flow behaviours. Document test conditions (supply velocities, pressure readings, equipment states). Provide clear interpretation statements , not merely raw footage. Include a conclusion section summarizing compliance with acceptance criteria. Reports should be retained as controlled documents supporting DQ, OQ, and PQ conclusions. 12. Remediation and Engineering Improvements When smoke studies identify risks, corrective actions may include: Adjusting HEPA airflow balance or diffuser layouts. Reconfiguring equipment or reducing obstruction height. Adding local airflow screens or baffles. Improving operator training and defining motion limits. Modifying process sequences to minimize turbulence during critical exposures. Enhancing airlock performance or reducing door cycling frequency. Changes should be re-tested to confirm effectiveness. 13. Frequency of Smoke Studies and Lifecycle Application Annex 1 requires smoke visualization not only for initial qualification but also during lifecycle operation. Recommended frequency: Initial OQ and PQ for all critical areas. After major layout or equipment changes that affect airflow. Periodically (e.g., every 1–3 years) based on risk. As part of investigations into contamination events or EM excursion trends. Results help ensure the cleanroom’s airflow remains compliant as processes and equipment evolve. 14. Conclusion Smoke visualization studies provide essential insights into airflow behaviour in critical cleanroom zones. When executed with technical rigor and interpreted through an engineering and contamination-control lens, they reveal subtle but impactful airflow disturbances that may compromise aseptic integrity or product safety. By integrating smoke visualization throughout the qualification lifecycle and aligning results with CCS and risk assessments, facilities can verify that airflow patterns consistently support sterile operations and maintain compliance with ISO 14644 and EU GMP Annex 1 expectations. Read more here: About Cleanrooms: The ultimate Guide
Show More